Kafka Through a Real Use Case: Building an Uptime Monitoring Pipeline
A practical walk through of Kafka, first the entities in plain words, then a real high scale use case (an uptime monitoring service checking 10 million endpoints), and finally how to actually pick your partitions, consumers, brokers and consumer group.
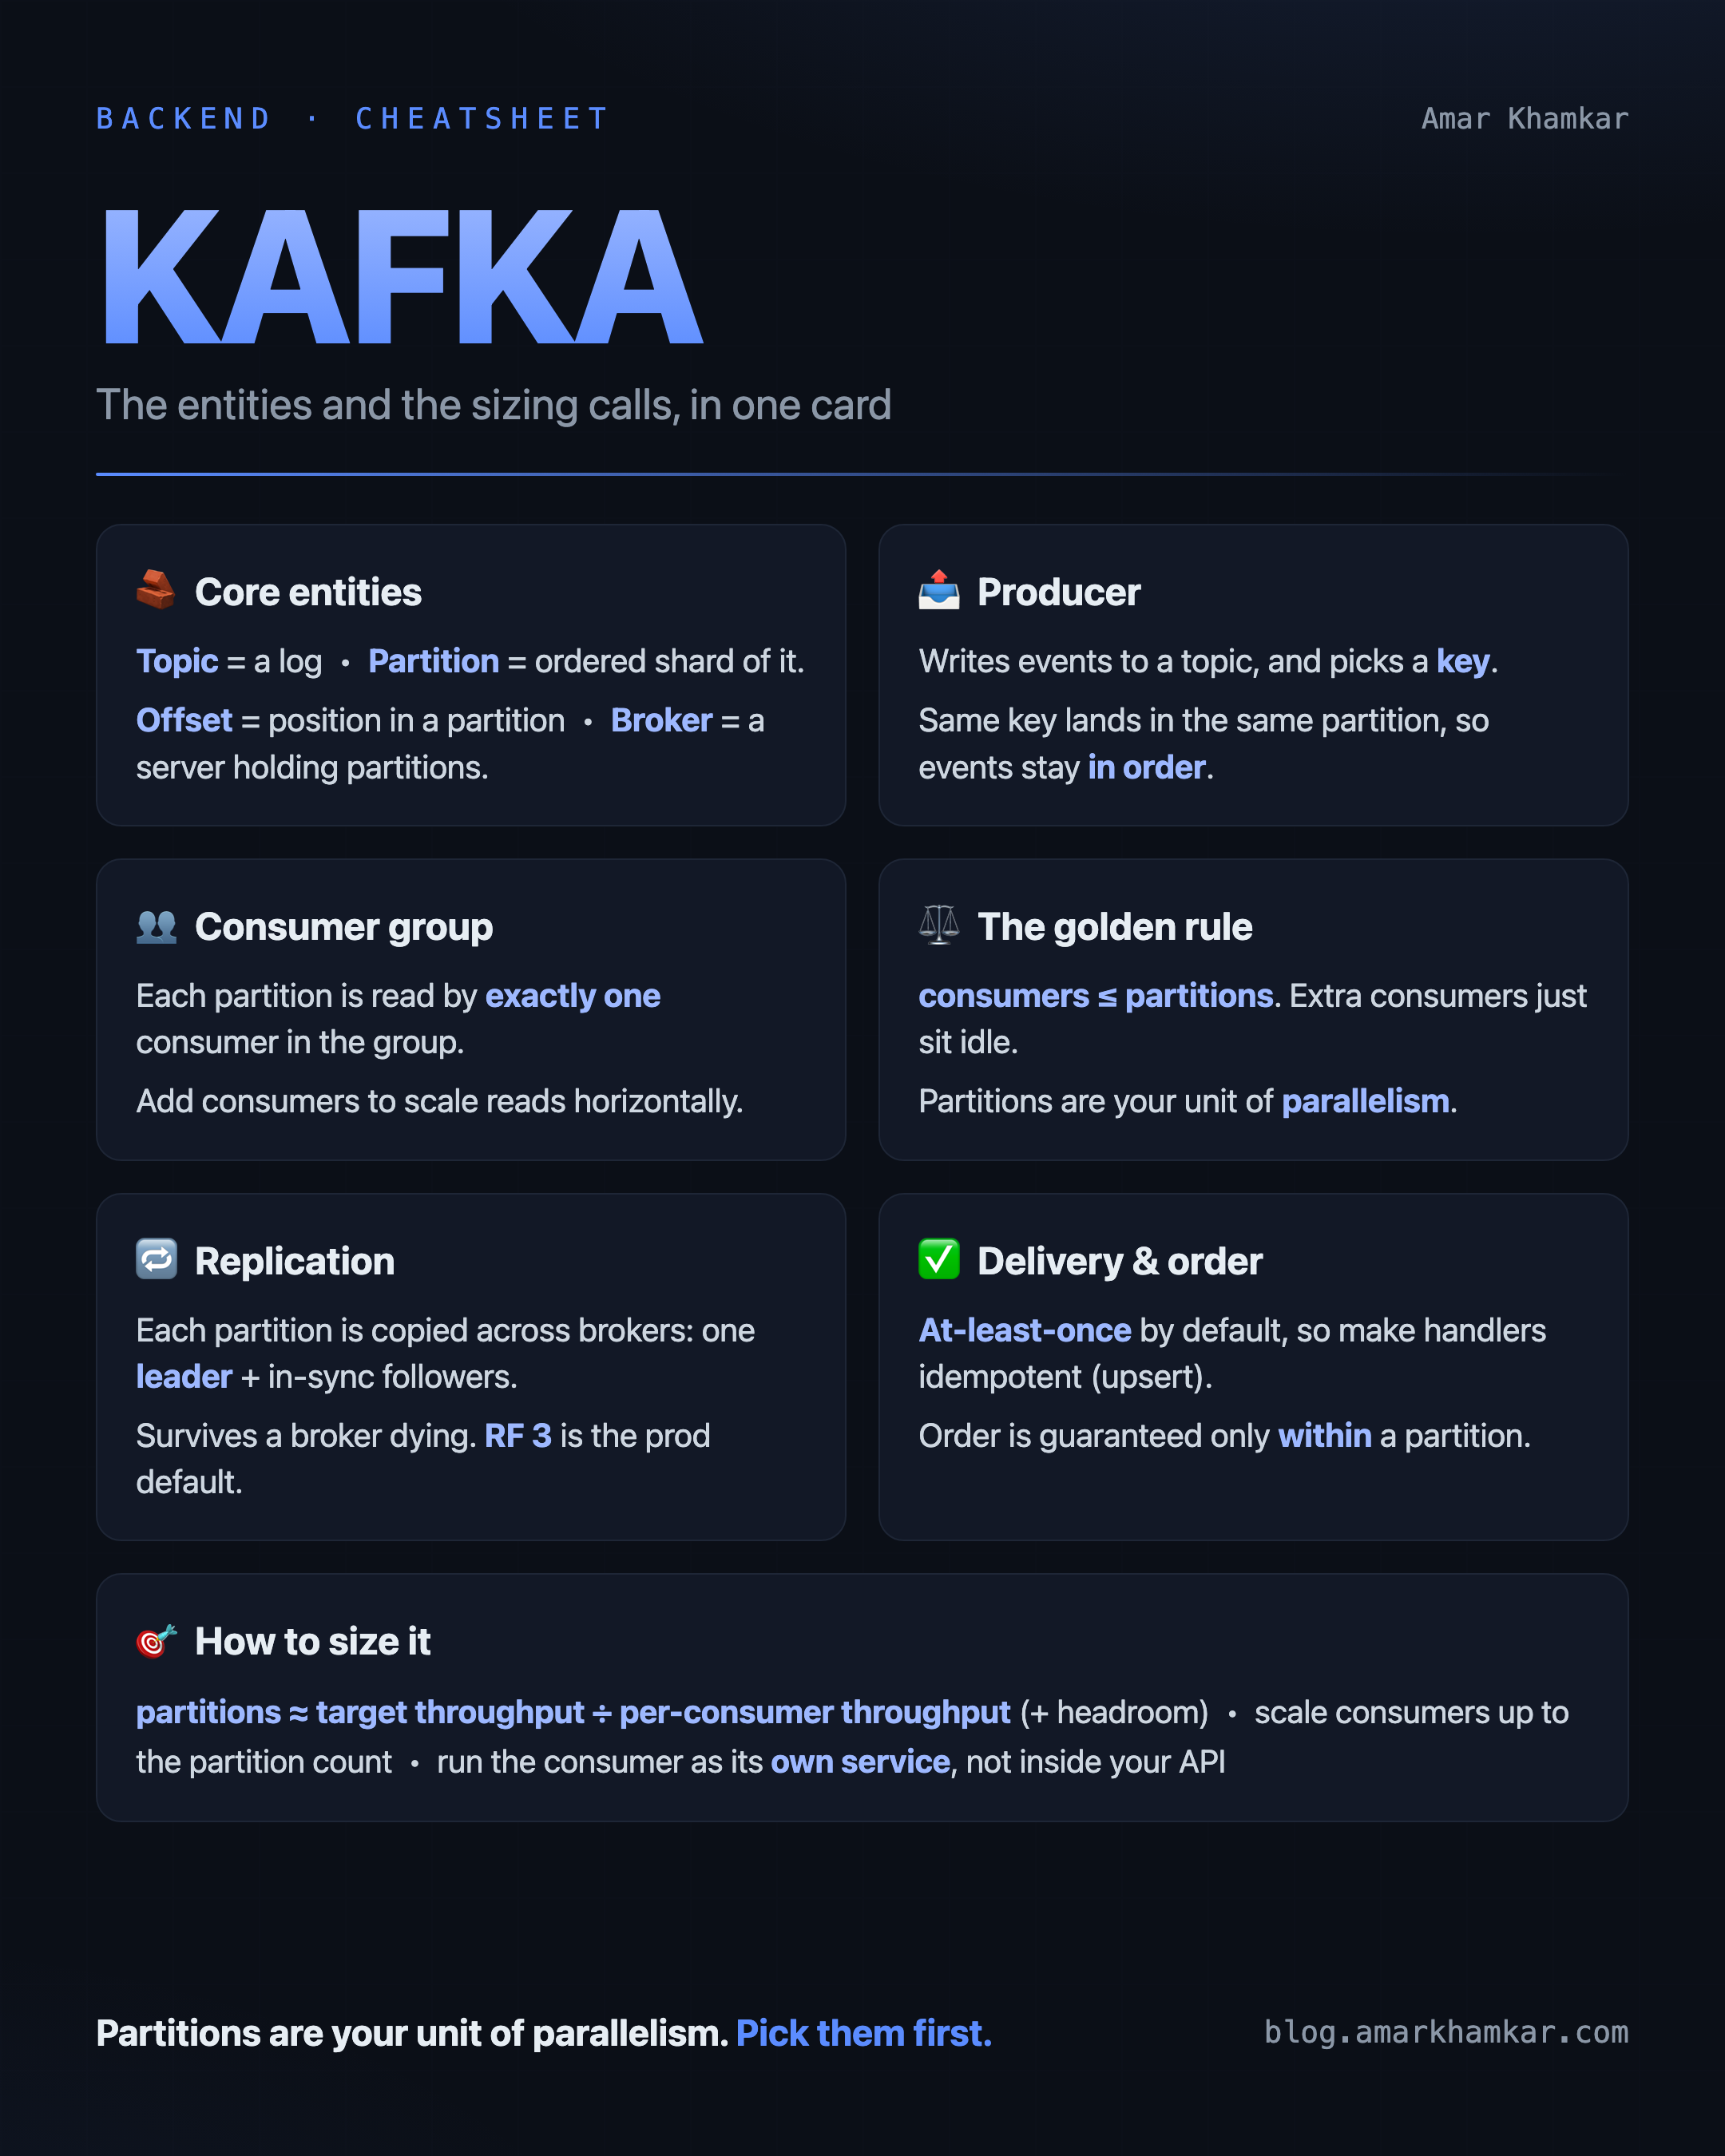
Kafka is one of those tools that sounds scarier than it is. Topics, partitions, brokers, consumer groups, offsets, the vocabulary alone can put you off. But once you tie it to a real problem, it clicks quite fast.
So in this post I want to do three things, in order. First explain the entities in plain words. Then look at a real, high scale use case, an uptime monitoring service. And finally, the part most tutorials skip, how do you actually decide the numbers, how many partitions, how many consumers, how many brokers, and how to set up the consumer group.
Here is the problem we will design for the whole way through.
We run an uptime monitoring service (think of something like Pingdom or UptimeRobot). We have 10 million monitors in our database, each one is a URL or endpoint that we must check regularly, say every 5 minutes, to see if it is up. Each check is a slow outbound HTTP call. How do we fan this huge amount of work out across many worker machines, reliably, without hammering one box or losing checks?
This is a textbook Kafka job. Let’s build up to it.
The entities, in plain words
Think of Kafka as a durable log of events that many services can write to and read from. Here are the pieces, tied to our monitoring service.
-
Event (message): a single record. For us, one “check job”, like
{"monitorId":123,"url":"https://acme.com/health"}. Kafka does not care what is inside, it just stores the bytes. -
Topic: a named stream of events, for us
health.checks. Producers write to it, consumers read from it. A topic is really just an append only log. -
Partition: the important one. A topic is split into one or more partitions, and each partition is an ordered, append only sequence of events. Partitions are how Kafka scales, because different partitions can live on different machines and be read in parallel. Order is guaranteed within a partition, not across partitions.
-
Offset: the position of an event inside a partition, just a number that keeps increasing. A consumer remembers “I have read up to offset 42 in partition 0”, and that is how it knows where to resume.
-
Broker: a single Kafka server. A broker holds some of the partitions and serves reads and writes for them. A cluster is a group of brokers working together.
-
Producer: whoever writes events into a topic. For us, the scheduler that decides which monitors are due and enqueues a check job for each. When it writes, it can pick a key (the monitor id), and Kafka uses that key to decide which partition the event goes to.
-
Consumer: whoever reads events and does the work. For us, a worker that takes a check job, makes the HTTP call, and records whether the site was up.
-
Consumer group: a set of consumers that share the work of reading a topic. Kafka gives each partition to exactly one consumer inside a group. So if the topic has 200 partitions and the group has 50 consumers, each consumer reads 4 partitions. Add more consumers and the work gets rebalanced. This is how we scale the workers horizontally, up to the number of partitions.
-
Replication: each partition can be copied to multiple brokers. One copy is the leader and the others are followers that stay in sync. If the broker holding the leader dies, a follower takes over, so we do not lose queued check jobs. The number of copies is the replication factor (3 is common in production).
The use case: designing a health monitoring system
Let’s design a small uptime monitoring system, the kind of thing that watches a set of websites or endpoints and tells you the moment one goes down. A user adds the URLs they want watched, and the system’s job is to check each one on a schedule (say every 5 minutes), record whether it was up or down, and alert someone if it was down.
At a small scale you could do this with a cron job and a simple loop. The interesting part is scale. Imagine we are watching 10 million monitors, each one due for a check every 5 minutes, and each check is a slow outbound HTTP call that can take a second or more. Now we have to spread that work across many machines, not lose any checks if a machine dies, and absorb the bursts when a lot of monitors fall due at the same instant. That combination, high fan-out, slow per item work, and no data loss, is exactly what Kafka is good at. So we will put Kafka at the center of the design.
Here is the shape of the pipeline.
1
2
3
4
5
6
7
 Scheduler (producer)                         Worker pods (consumers)

  every tick, find monitors due  ──►  ┌────────────────┐  ──►  worker pulls a job
  publish one job per monitor    ──►  │  health.checks  │  ──►  makes the HTTP call
  (keyed by monitor id)               │  (Kafka topic,  │  ──►  records up / down in DB
                                       │   many partitions)│
                                       └────────────────┘
Two moving parts:
- A scheduler (the producer) wakes up on each tick, queries the DB for monitors that are due for a check, and publishes one check job per monitor onto the
health.checkstopic. On a busy tick this can be hundreds of thousands of jobs at once. - A pool of worker pods (the consumers, all in one group) read those jobs, make the actual HTTP call to each target, and write the result back.
Why put Kafka in the middle instead of just having the scheduler call the workers directly?
- It absorbs bursts. If a tick dumps 300k jobs and the workers can only chew through them over the next couple of minutes, the jobs simply wait in the topic. Nothing is dropped, the workers just catch up.
- It decouples scheduling from checking. The scheduler does not know or care how many workers exist. You can scale workers up and down freely.
- It survives worker crashes. If a worker dies mid batch, those jobs are not lost, another worker picks them up from the last committed offset.
- You can replay. If a bug made you record bad results for an hour, you can reset the offset and reprocess.
Here is the producer (the scheduler), publishing jobs keyed by monitor id, using kafkajs:
1
2
3
4
5
6
7
8
9
10
11
12
13
14
const { Kafka } = require("kafkajs");

const kafka = new Kafka({ clientId: "scheduler", brokers: ["broker1:9092", "broker2:9092"] });
const producer = kafka.producer();

async function enqueueDueChecks(dueMonitors) {
  await producer.send({
    topic: "health.checks",
    messages: dueMonitors.map((m) => ({
      key: String(m.id),                       // same monitor -> same partition
      value: JSON.stringify({ monitorId: m.id, url: m.url }),
    })),
  });
}
And the worker (a consumer), doing the actual check and recording the result. Note the manual offset commit, more on that below:
1
2
3
4
5
6
7
8
9
10
11
12
13
14
15
16
17
18
19
20
21
22
23
24
const { Kafka } = require("kafkajs");

const kafka = new Kafka({ clientId: "health-worker", brokers: ["broker1:9092", "broker2:9092"] });
const consumer = kafka.consumer({ groupId: "health-workers" });

async function start() {
  await consumer.connect();
  await consumer.subscribe({ topic: "health.checks", fromBeginning: false });

  await consumer.run({
    autoCommit: false, // we commit ourselves, only after the check is done
    eachMessage: async ({ topic, partition, message }) => {
      const { monitorId, url } = JSON.parse(message.value.toString());

      const result = await runHealthCheck(url);   // the slow HTTP call
      await db.results.upsert({ monitorId, result, at: Date.now() });

      // only now do we move the bookmark forward
      await consumer.commitOffsets([
        { topic, partition, offset: (Number(message.offset) + 1).toString() },
      ]);
    },
  });
}
A couple of things to notice, and they matter a lot at this scale. I keyed jobs by monitor id so two overlapping checks for the same monitor cannot run out of order or in parallel on different workers. And recording the result is an upsert, because Kafka delivers “at least once”, so the same job can occasionally be processed twice, and doing it twice should be safe.
A common misconception: is Kafka pub/sub or a message queue?
Worth clearing up, because it trips up almost everyone. People often say “Kafka is a pub/sub system, not a message queue.” That is only half right. Kafka is really a distributed log, and depending on how you use consumer groups it can behave as either one.
- Like a queue (competing consumers). Put all your consumers in the same group, and Kafka splits the partitions among them, so each message is handled by exactly one consumer in that group. That is a work queue, and it is exactly what our monitoring workers do, the check jobs get divided across the one
health-workersgroup. - Like pub/sub (fan-out). Add a second consumer group on the same topic, and that group independently reads all the messages too. So the
health-workersgroup can be doing the checks, while a separateauditgroup reads the samehealth.checkstopic to log every job. Each group gets the full stream.
The other thing that makes Kafka different from a classic queue like RabbitMQ or SQS, it does not delete a message when it is consumed. A traditional queue removes a message once a consumer acknowledges it. Kafka keeps every message for its retention period, and each consumer group just tracks its own offset. That is what lets multiple groups read the same data independently, and what lets you replay by rewinding an offset. In a classic queue, once a message is consumed, it is gone.
So the accurate way to say it is, Kafka is a log that gives you queue semantics within a group and pub/sub semantics across groups. Our monitoring design leans on the queue side.
Now the real question: how do you pick the numbers?
This is where most explanations stop, but it is the part that actually matters when you build it. Let’s start with the load.
- 10 million monitors, each checked every 5 minutes (300 seconds).
- So the pipeline must sustain
10,000,000 / 300 ≈ 33,000 checks per second.
Hold on to that number, ~33k/sec. Everything below flows from it.
Producers
On the producer side (the scheduler), three decisions matter.
- Partition key. Key every job by the monitor id. Kafka hashes the key to choose a partition, so all jobs for a given monitor land on the same partition and are processed in order by one worker. That stops two workers checking the same monitor at the same instant. (If you did not care about that, you could skip the key and let jobs spread evenly, but here keying is the safer choice.)
- acks (durability). Set
acks=allso a job is only acknowledged once the leader and its in sync replicas have it. You do not want to lose a batch of queued checks because a broker restarted. - Idempotent producer. Turn on
enable.idempotence=trueso an internal retry does not enqueue the same job twice.
You do not need many producer instances, a single scheduler (or a small number) can push tens of thousands of small messages per second through a few connections.
Brokers and replication factor
A broker is one Kafka server, and your partitions physically live on brokers. The replication factor is how many copies of each partition Kafka keeps on different brokers for fault tolerance.
The rule that confuses people: your replication factor cannot exceed the number of brokers. The reason is simple once you see it, each copy of a partition has to sit on a different broker (two copies on the same machine would both die together, which defeats the point). So a replication factor of 3 needs at least 3 brokers.
For production you almost always want replication factor 3 (plus min.insync.replicas=2), because then you can lose one entire broker and still have the data on two others and keep accepting writes.
Now bring in our numbers. Say we settle on 200 partitions (why, in a second). With replication factor 3 that is 200 × 3 = 600 partition copies that have to be spread across the cluster. On a cluster of, say, 6 brokers, that is about 100 partition copies per broker, comfortable. If you only had 3 brokers, each would carry all 200, which is heavier and leaves no room when one broker dies. So “more brokers” buys you two things, headroom for the replication factor, and spreading the partitions (and their load) across more machines. As an app team you usually do not own the broker count, you just make sure the cluster has enough brokers for RF 3 and your partition count.
Partitions (the most important choice)
Partitions are your unit of parallelism, because a partition is read by only one consumer in a group. So the partition count is the ceiling on how many workers can run in parallel. This is the number to decide first.
Here is the key insight for this use case. Our messages are tiny (a monitor id and a URL, maybe 200 bytes), so at 33k/sec we are only moving about 6 MB/s, which is nothing for Kafka. The partition count here is not about byte throughput at all. It is about processing parallelism, because each job is a slow outbound HTTP call.
So size partitions by how much work one consumer can do:
1
partitions ≈ target rate / rate one consumer can handle
Say one worker keeps around 200 HTTP checks in flight and an average check (including slow and timing out ones) takes about a second. That is roughly 200 checks/sec per worker. To hit 33k/sec:
1
33,000 / 200 ≈ 165 workers needed
So you want at least ~165 partitions, and you would round up with headroom to something like 200 partitions. That headroom matters because increasing partitions later is possible but a bit painful (it changes how keys map to partitions).
This is the lesson worth stealing, when each message is slow to process, you need a lot of partitions even though the data volume is tiny. Partition count tracks your parallelism, not your bytes.
Consumers and the consumer group
All your workers share one consumer group, say health-workers. The single rule that governs everything:
1
number of consumers ≤ number of partitions
With 200 partitions you can run up to 200 worker consumers. Beyond 200 the extra ones just sit idle, they get no partition. So you would run something like 20 worker pods with 10 consumer instances each (200 consumers total), or 40 pods of 5, whatever fits your pod sizing.
Where do the consumers run? As their own worker deployment, separate from any API service. Spread the consumers across multiple pods so that if one pod dies, the others keep draining the topic (after a quick rebalance), and Kafka just redistributes that pod’s partitions to the survivors.
How are partitions assigned, and what happens when a worker restarts? That is the assignment strategy and rebalancing, which get their own section next.
A sanity check on the things downstream
One trap, do not forget what the workers actually hit. At 33k checks/sec you are making 33k outbound HTTP calls per second and writing 33k results/sec to your database. Both can become the real bottleneck long before Kafka does. So batch the result writes, size your DB connection pools, and make sure the targets (and your own egress) can take that rate. It is worth doing this math early, because at this scale Kafka is rarely the part that falls over first.
Auto-commit vs manual commit
There is one consumer setting that quietly decides whether you lose work: when does the consumer commit its offset.
Committing an offset just means the consumer telling Kafka “I have processed up to here”, so that on a restart or rebalance it resumes from that point. There are two ways to do it.
-
Auto-commit (
enable.auto.commit=true, the default in most clients): the client commits the latest fetched offsets automatically on a timer. Simple, but dangerous for us, because it commits based on what you pulled, not what you finished. If the timer commits a batch of jobs and then the worker crashes before the HTTP checks actually run, Kafka thinks those checks are done and they are silently never run. For a monitoring service, that means a monitor quietly stops being checked. -
Manual commit (
enable.auto.commit=false): you commit after the work succeeds, like in the worker code above. If the worker crashes after the check but before the commit, the job just runs again on restart (a duplicate), which is fine because recording the result is an idempotent upsert.
The rule of thumb, if losing a message is acceptable (metrics, low value logs), auto-commit is fine and simpler. If losing a message is not acceptable (a health check that must run, a payment, a sync), use manual commit and commit only after you have really done the work.
Choosing an assignment strategy, and surviving rebalances
Two things about consumer groups trip people up once real traffic hits, how partitions get assigned to consumers, and what happens every time the group changes.
How partitions get assigned
When consumers join a group, Kafka decides which consumer reads which partition. That decision is the assignment strategy:
- Range (the default): for each topic it hands out contiguous ranges of partitions to the consumers. Fine for a single topic like ours, but can get uneven when one group consumes several topics.
- Round robin: spreads partitions one by one across all consumers, so the load is more even, which helps when a group subscribes to many topics.
- Sticky / cooperative sticky: tries to keep each consumer on the partitions it already had, so a rebalance moves as few partitions as possible. On modern Kafka (2.4+), cooperative sticky is usually the best choice, especially with 200 consumers where a full reshuffle is expensive.
What a rebalance is, and why it can hurt
A rebalance is Kafka re dividing the partitions among the consumers whenever group membership changes, a worker joins, leaves, dies, or partitions are added.
The catch is the old eager, stop the world style, where on any change every consumer drops all its partitions and waits for a fresh assignment. With 200 workers, one pod restarting could briefly stall the entire fleet, and checks pile up. That is why the modern cooperative rebalancing matters, only the partitions that actually need to move are handed over, and everyone else keeps working.
Practical tips to keep rebalances calm
- Keep the consumer count stable. Every scale event and crash is a rebalance, so do not autoscale workers aggressively on a spiky signal.
- Tune the timeouts. Set
session.timeout.msandheartbeat.interval.msso a short GC pause or a slow HTTP check does not get a healthy worker wrongly kicked out. - Use static membership. A stable
group.instance.idper worker lets Kafka recognise a restarting pod as the same member, so a rolling deploy does not reshuffle all 200 partitions. - Shut down gracefully so a worker commits its offsets and leaves the group cleanly instead of timing out.
A few gotchas worth knowing
- Order is only per partition. Keying by monitor id keeps each monitor’s checks ordered, but there is no ordering across different monitors, which is exactly what we want here.
- Make handlers idempotent. At least once delivery means a job can run twice. Upserting the result (rather than inserting) keeps that safe.
- Watch consumer lag. Lag is how far behind the workers are from the newest offset. Growing lag here has a very concrete meaning, your monitors are being checked late. If lag climbs, you need more partitions and workers, or faster checks.
- Handle poison jobs. A URL that always times out should not be retried forever and block a partition. Cap the retries and push it to a dead letter topic for later inspection.
- Mind the downstream. At 33k/sec the HTTP targets and your database are the likely bottlenecks, not Kafka. Batch writes and pool connections.
Wrapping up
If you strip Kafka down to one idea, it is this. A topic is a log, split into partitions, and partitions are your unit of parallelism. Almost every sizing decision flows from that. In our monitoring pipeline the whole design fell out of two numbers, 33k checks per second and about 200 checks per second per worker, which told us we needed roughly 200 partitions, up to 200 worker consumers spread across pods, on a cluster with enough brokers to hold replication factor 3.
And notice the theme that kept coming back, partitions track your processing parallelism, not your data volume. Our messages were tiny, but the work behind each one was slow, so we needed a lot of partitions. Get that one idea right and the rest of Kafka is mostly variations on it.
If you want, I can write a follow up on the scheduler side (how to avoid a thundering herd every tick), or on failure handling with retries and a dead letter topic. Tell me in the comments.