<?xml version="1.0" encoding="utf-8"?><feed xmlns="http://www.w3.org/2005/Atom" xml:lang="en"><generator uri="https://jekyllrb.com/" version="4.4.1">Jekyll</generator><link href="https://blog.amarkhamkar.com/feed.xml" rel="self" type="application/atom+xml" /><link href="https://blog.amarkhamkar.com/" rel="alternate" type="text/html" hreflang="en" /><updated>2026-08-27T19:23:11+00:00</updated><id>https://blog.amarkhamkar.com/feed.xml</id><title type="html">Amar’s Blog</title><subtitle>A blogging website by amar khamkar where my main focus is to provide tutorials on programming, designing and other technical stuff. And also to share/gain the knowledge with/from the world.</subtitle><entry><title type="html">Request Coalescing: When a Million Requests Want the Same Data</title><link href="https://blog.amarkhamkar.com/posts/REQUEST-COALESCING/" rel="alternate" type="text/html" title="Request Coalescing: When a Million Requests Want the Same Data" /><published>2026-08-14T04:30:00+00:00</published><updated>2026-08-14T04:30:00+00:00</updated><id>https://blog.amarkhamkar.com/posts/REQUEST-COALESCING</id><content type="html" xml:base="https://blog.amarkhamkar.com/posts/REQUEST-COALESCING/"><![CDATA[<p>Let me start with a situation we have all seen from the outside. Some post blows up on Reddit or a channel goes crazy on Discord, and suddenly a huge number of people are opening the exact same page at the exact same time. They are all asking your backend for the <strong>same</strong> piece of data.</p>

<p>The data itself is basically static for that moment. It is the same post, the same numbers, the same content for everyone. So the interesting question is, do we really need to hit the database once for every single one of these requests? Clearly not. And once you start pulling on that thread, it leads to a nice little chain of optimizations that ends in a pub/sub trick. Let me walk through the whole thinking.</p>

<hr />

<h2 id="step-1-put-redis-in-front-the-obvious-win">Step 1: put Redis in front, the obvious win</h2>

<p>The first thing anyone does is add a cache. Put Redis in front of the database and use the classic cache aside pattern.</p>

<div class="language-js highlighter-rouge"><div class="highlight"><pre class="highlight"><code><table class="rouge-table"><tbody><tr><td class="rouge-gutter gl"><pre class="lineno">1
2
3
4
5
6
7
8
9
10
11
12
13
14
15
</pre></td><td class="rouge-code"><pre><span class="k">async</span> <span class="kd">function</span> <span class="nf">getPost</span><span class="p">(</span><span class="nx">id</span><span class="p">)</span> <span class="p">{</span>
  <span class="kd">const</span> <span class="nx">key</span> <span class="o">=</span> <span class="s2">`post:</span><span class="p">${</span><span class="nx">id</span><span class="p">}</span><span class="s2">`</span><span class="p">;</span>

  <span class="c1">// 1. try the cache</span>
  <span class="kd">const</span> <span class="nx">cached</span> <span class="o">=</span> <span class="k">await</span> <span class="nx">redis</span><span class="p">.</span><span class="nf">get</span><span class="p">(</span><span class="nx">key</span><span class="p">);</span>
  <span class="k">if </span><span class="p">(</span><span class="nx">cached</span><span class="p">)</span> <span class="k">return</span> <span class="nx">JSON</span><span class="p">.</span><span class="nf">parse</span><span class="p">(</span><span class="nx">cached</span><span class="p">);</span>

  <span class="c1">// 2. miss, go to the database</span>
  <span class="kd">const</span> <span class="nx">post</span> <span class="o">=</span> <span class="k">await</span> <span class="nx">db</span><span class="p">.</span><span class="nf">query</span><span class="p">(</span><span class="dl">"</span><span class="s2">SELECT * FROM posts WHERE id = ?</span><span class="dl">"</span><span class="p">,</span> <span class="p">[</span><span class="nx">id</span><span class="p">]);</span>

  <span class="c1">// 3. put it in the cache for next time</span>
  <span class="k">await</span> <span class="nx">redis</span><span class="p">.</span><span class="nf">set</span><span class="p">(</span><span class="nx">key</span><span class="p">,</span> <span class="nx">JSON</span><span class="p">.</span><span class="nf">stringify</span><span class="p">(</span><span class="nx">post</span><span class="p">),</span> <span class="dl">"</span><span class="s2">EX</span><span class="dl">"</span><span class="p">,</span> <span class="mi">60</span><span class="p">);</span>

  <span class="k">return</span> <span class="nx">post</span><span class="p">;</span>
<span class="p">}</span>
</pre></td></tr></tbody></table></code></pre></div></div>

<p>This already solves most of the problem. The first request fills the cache, and after that everyone reads from Redis. And Redis is comfortable with this kind of load, a single node handles well over a hundred thousand ops per second, and with Redis Cluster you are into the millions of reads per second range without breaking a sweat. So for pure reads of hot data, Redis absorbs the storm and the database barely notices.</p>

<p>So far so good. If this was the whole story, there would be no blog post. The problem is hiding in one specific moment.</p>

<hr />

<h2 id="step-2-the-moment-it-all-breaks-cache-stampede">Step 2: the moment it all breaks (cache stampede)</h2>

<p>Look closely at what happens when the key is <strong>not</strong> in the cache. There are two very normal times this is true:</p>

<ul>
  <li>The very first time anyone asks for this post (cold cache).</li>
  <li>The instant the key <strong>expires</strong>. Our <code class="language-plaintext highlighter-rouge">EX 60</code> means every 60 seconds the key vanishes for a moment.</li>
</ul>

<p>Now replay the viral scenario at exactly that instant. A million concurrent requests come in. They <strong>all</strong> run <code class="language-plaintext highlighter-rouge">redis.get</code>, they <strong>all</strong> miss (because the key is not there yet), and so they <strong>all</strong> fall through to the database at the same time. Then they <strong>all</strong> try to write the result back into Redis.</p>

<div class="language-plaintext highlighter-rouge"><div class="highlight"><pre class="highlight"><code><table class="rouge-table"><tbody><tr><td class="rouge-gutter gl"><pre class="lineno">1
2
3
4
5
6
7
</pre></td><td class="rouge-code"><pre>   million concurrent requests, key just expired
   │  │  │  │  │  │  │  │  │  │  │  │  │  │  │
   ▼  ▼  ▼  ▼  ▼  ▼  ▼  ▼  ▼  ▼  ▼  ▼  ▼  ▼  ▼
        all miss the cache at the same time
                     │
                     ▼
        all hammer the DATABASE at once   ← the stampede
</pre></td></tr></tbody></table></code></pre></div></div>

<p>This is called a <strong>cache stampede</strong> (also thundering herd, or dogpile). The cache was supposed to protect the database, but at the exact moment of a miss it protects nothing, and the database gets hit by thousands of identical, and often expensive, queries all at once. If that query is heavy (a big join, an aggregation), your database can fall over from a load it was never actually required to do, because remember, the answer is the same for everyone. We only needed to run it <strong>once</strong>.</p>

<p>And it is worse than just reads. In many designs that “populate the cache” step is not a plain set, it is a write into the database too, or an insert of a computed/derived row. Writes and inserts are much heavier than reads for a database, and now you have thousands of concurrent inserts for the <strong>same</strong> data racing each other. That is a lot of wasted, duplicated, expensive work.</p>

<p>So the real problem statement is, <strong>how do we make sure that when many requests want the same missing data, only one of them actually does the work, and everyone else just waits for that one result?</strong></p>

<hr />

<h2 id="step-3-single-flight-only-one-request-does-the-work">Step 3: single flight, only one request does the work</h2>

<p>The idea has a nice name, <strong>single flight</strong>. For a given key, only allow one in flight computation at a time. Everyone else who wants the same key while it is being computed should not start their own, they should attach to the one already running.</p>

<p>Within a single Node.js process, you get this almost for free with a map of in flight promises:</p>

<div class="language-js highlighter-rouge"><div class="highlight"><pre class="highlight"><code><table class="rouge-table"><tbody><tr><td class="rouge-gutter gl"><pre class="lineno">1
2
3
4
5
6
7
8
9
10
11
12
13
14
15
16
17
18
19
20
21
22
23
24
25
26
</pre></td><td class="rouge-code"><pre><span class="kd">const</span> <span class="nx">inFlight</span> <span class="o">=</span> <span class="k">new</span> <span class="nc">Map</span><span class="p">();</span>

<span class="k">async</span> <span class="kd">function</span> <span class="nf">getPostCoalesced</span><span class="p">(</span><span class="nx">id</span><span class="p">)</span> <span class="p">{</span>
  <span class="kd">const</span> <span class="nx">key</span> <span class="o">=</span> <span class="s2">`post:</span><span class="p">${</span><span class="nx">id</span><span class="p">}</span><span class="s2">`</span><span class="p">;</span>

  <span class="kd">const</span> <span class="nx">cached</span> <span class="o">=</span> <span class="k">await</span> <span class="nx">redis</span><span class="p">.</span><span class="nf">get</span><span class="p">(</span><span class="nx">key</span><span class="p">);</span>
  <span class="k">if </span><span class="p">(</span><span class="nx">cached</span><span class="p">)</span> <span class="k">return</span> <span class="nx">JSON</span><span class="p">.</span><span class="nf">parse</span><span class="p">(</span><span class="nx">cached</span><span class="p">);</span>

  <span class="c1">// is someone already fetching this key right now?</span>
  <span class="k">if </span><span class="p">(</span><span class="nx">inFlight</span><span class="p">.</span><span class="nf">has</span><span class="p">(</span><span class="nx">key</span><span class="p">))</span> <span class="p">{</span>
    <span class="k">return</span> <span class="nx">inFlight</span><span class="p">.</span><span class="nf">get</span><span class="p">(</span><span class="nx">key</span><span class="p">);</span> <span class="c1">// attach to the existing work, do not start your own</span>
  <span class="p">}</span>

  <span class="kd">const</span> <span class="nx">promise</span> <span class="o">=</span> <span class="p">(</span><span class="k">async </span><span class="p">()</span> <span class="o">=&gt;</span> <span class="p">{</span>
    <span class="kd">const</span> <span class="nx">post</span> <span class="o">=</span> <span class="k">await</span> <span class="nx">db</span><span class="p">.</span><span class="nf">query</span><span class="p">(</span><span class="dl">"</span><span class="s2">SELECT * FROM posts WHERE id = ?</span><span class="dl">"</span><span class="p">,</span> <span class="p">[</span><span class="nx">id</span><span class="p">]);</span>
    <span class="k">await</span> <span class="nx">redis</span><span class="p">.</span><span class="nf">set</span><span class="p">(</span><span class="nx">key</span><span class="p">,</span> <span class="nx">JSON</span><span class="p">.</span><span class="nf">stringify</span><span class="p">(</span><span class="nx">post</span><span class="p">),</span> <span class="dl">"</span><span class="s2">EX</span><span class="dl">"</span><span class="p">,</span> <span class="mi">60</span><span class="p">);</span>
    <span class="k">return</span> <span class="nx">post</span><span class="p">;</span>
  <span class="p">})();</span>

  <span class="nx">inFlight</span><span class="p">.</span><span class="nf">set</span><span class="p">(</span><span class="nx">key</span><span class="p">,</span> <span class="nx">promise</span><span class="p">);</span>
  <span class="k">try</span> <span class="p">{</span>
    <span class="k">return</span> <span class="k">await</span> <span class="nx">promise</span><span class="p">;</span>
  <span class="p">}</span> <span class="k">finally</span> <span class="p">{</span>
    <span class="nx">inFlight</span><span class="p">.</span><span class="k">delete</span><span class="p">(</span><span class="nx">key</span><span class="p">);</span> <span class="c1">// clear it once done, so the next miss can refetch</span>
  <span class="p">}</span>
<span class="p">}</span>
</pre></td></tr></tbody></table></code></pre></div></div>

<p>Now if a thousand requests hit the same process during that miss window, the <strong>first</strong> one starts the database query and the other 999 simply <code class="language-plaintext highlighter-rouge">await</code> the same promise. One database call, one cache write, a thousand happy responses.</p>

<p>This is exactly what Go’s <code class="language-plaintext highlighter-rouge">singleflight</code> package does, and it is a genuinely underused pattern.</p>

<hr />

<h2 id="step-4-but-we-have-many-pods-not-one-process">Step 4: but we have many pods, not one process</h2>

<p>Here is the catch. In real life your app is not one process, it is 40 pods behind a load balancer. That in memory <code class="language-plaintext highlighter-rouge">Map</code> only coalesces requests <strong>inside one pod</strong>. Across 40 pods you still get up to 40 concurrent database calls at the miss instant, one per pod. Much better than a million, but still not the “exactly once” we want, and if the query is heavy even 40 at once can hurt.</p>

<p>To coordinate across all pods, we need a shared point of truth, and we already have one sitting right there, <strong>Redis</strong>.</p>

<p>The trick is a <strong>lock</strong>. The first request to arrive grabs a short lock in Redis, and only the holder of that lock is allowed to go to the database. <code class="language-plaintext highlighter-rouge">SET key value NX EX ttl</code> is perfect for this, because <code class="language-plaintext highlighter-rouge">NX</code> means “only set if it does not already exist”, so exactly one request across the whole fleet wins it.</p>

<div class="language-js highlighter-rouge"><div class="highlight"><pre class="highlight"><code><table class="rouge-table"><tbody><tr><td class="rouge-gutter gl"><pre class="lineno">1
2
3
4
5
6
7
8
9
10
11
12
13
14
15
16
17
18
19
20
21
</pre></td><td class="rouge-code"><pre><span class="k">async</span> <span class="kd">function</span> <span class="nf">getPostGlobal</span><span class="p">(</span><span class="nx">id</span><span class="p">)</span> <span class="p">{</span>
  <span class="kd">const</span> <span class="nx">key</span> <span class="o">=</span> <span class="s2">`post:</span><span class="p">${</span><span class="nx">id</span><span class="p">}</span><span class="s2">`</span><span class="p">;</span>
  <span class="kd">const</span> <span class="nx">lockKey</span> <span class="o">=</span> <span class="s2">`lock:</span><span class="p">${</span><span class="nx">key</span><span class="p">}</span><span class="s2">`</span><span class="p">;</span>

  <span class="kd">const</span> <span class="nx">cached</span> <span class="o">=</span> <span class="k">await</span> <span class="nx">redis</span><span class="p">.</span><span class="nf">get</span><span class="p">(</span><span class="nx">key</span><span class="p">);</span>
  <span class="k">if </span><span class="p">(</span><span class="nx">cached</span><span class="p">)</span> <span class="k">return</span> <span class="nx">JSON</span><span class="p">.</span><span class="nf">parse</span><span class="p">(</span><span class="nx">cached</span><span class="p">);</span>

  <span class="c1">// try to become THE one who does the work (NX = only if not set)</span>
  <span class="kd">const</span> <span class="nx">gotLock</span> <span class="o">=</span> <span class="k">await</span> <span class="nx">redis</span><span class="p">.</span><span class="nf">set</span><span class="p">(</span><span class="nx">lockKey</span><span class="p">,</span> <span class="dl">"</span><span class="s2">1</span><span class="dl">"</span><span class="p">,</span> <span class="dl">"</span><span class="s2">NX</span><span class="dl">"</span><span class="p">,</span> <span class="dl">"</span><span class="s2">EX</span><span class="dl">"</span><span class="p">,</span> <span class="mi">10</span><span class="p">);</span>

  <span class="k">if </span><span class="p">(</span><span class="nx">gotLock</span><span class="p">)</span> <span class="p">{</span>
    <span class="c1">// I am the chosen one. Do the heavy work exactly once.</span>
    <span class="kd">const</span> <span class="nx">post</span> <span class="o">=</span> <span class="k">await</span> <span class="nx">db</span><span class="p">.</span><span class="nf">query</span><span class="p">(</span><span class="dl">"</span><span class="s2">SELECT * FROM posts WHERE id = ?</span><span class="dl">"</span><span class="p">,</span> <span class="p">[</span><span class="nx">id</span><span class="p">]);</span>
    <span class="k">await</span> <span class="nx">redis</span><span class="p">.</span><span class="nf">set</span><span class="p">(</span><span class="nx">key</span><span class="p">,</span> <span class="nx">JSON</span><span class="p">.</span><span class="nf">stringify</span><span class="p">(</span><span class="nx">post</span><span class="p">),</span> <span class="dl">"</span><span class="s2">EX</span><span class="dl">"</span><span class="p">,</span> <span class="mi">60</span><span class="p">);</span>
    <span class="k">await</span> <span class="nx">redis</span><span class="p">.</span><span class="nf">del</span><span class="p">(</span><span class="nx">lockKey</span><span class="p">);</span>
    <span class="k">return</span> <span class="nx">post</span><span class="p">;</span>
  <span class="p">}</span>

  <span class="c1">// someone else is already doing it. I just have to wait for the result.</span>
  <span class="k">return</span> <span class="nf">waitForResult</span><span class="p">(</span><span class="nx">key</span><span class="p">);</span>
<span class="p">}</span>
</pre></td></tr></tbody></table></code></pre></div></div>

<p>Now exactly <strong>one</strong> request in the whole cluster touches the database. Everyone else falls into <code class="language-plaintext highlighter-rouge">waitForResult</code>. The only question left is, how do the waiters get the answer?</p>

<hr />

<h2 id="step-5-polling-vs-pubsub-for-the-waiters">Step 5: polling vs pub/sub for the waiters</h2>

<p>The simplest way to wait is to <strong>poll</strong>. Every waiting request checks Redis every so often to see if the value has appeared yet.</p>

<div class="language-js highlighter-rouge"><div class="highlight"><pre class="highlight"><code><table class="rouge-table"><tbody><tr><td class="rouge-gutter gl"><pre class="lineno">1
2
3
4
5
6
7
8
</pre></td><td class="rouge-code"><pre><span class="k">async</span> <span class="kd">function</span> <span class="nf">waitForResult</span><span class="p">(</span><span class="nx">key</span><span class="p">)</span> <span class="p">{</span>
  <span class="k">for </span><span class="p">(</span><span class="kd">let</span> <span class="nx">i</span> <span class="o">=</span> <span class="mi">0</span><span class="p">;</span> <span class="nx">i</span> <span class="o">&lt;</span> <span class="mi">50</span><span class="p">;</span> <span class="nx">i</span><span class="o">++</span><span class="p">)</span> <span class="p">{</span>
    <span class="kd">const</span> <span class="nx">cached</span> <span class="o">=</span> <span class="k">await</span> <span class="nx">redis</span><span class="p">.</span><span class="nf">get</span><span class="p">(</span><span class="nx">key</span><span class="p">);</span>
    <span class="k">if </span><span class="p">(</span><span class="nx">cached</span><span class="p">)</span> <span class="k">return</span> <span class="nx">JSON</span><span class="p">.</span><span class="nf">parse</span><span class="p">(</span><span class="nx">cached</span><span class="p">);</span>
    <span class="k">await</span> <span class="nf">sleep</span><span class="p">(</span><span class="mi">50</span><span class="p">);</span> <span class="c1">// check again in 50ms</span>
  <span class="p">}</span>
  <span class="c1">// fallback: still nothing, do the work ourselves so we never hang forever</span>
<span class="p">}</span>
</pre></td></tr></tbody></table></code></pre></div></div>

<p>You can even make this richer by storing a small <strong>status</strong> value, so waiters can see the stage the work is in (“pending”, “fetching”, “ready”) instead of guessing. That was actually my first instinct too, push the request state into Redis and let everyone poll it.</p>

<p>Polling works, but it has two annoyances. You are still making a Redis call on every poll from every waiting request, so a million waiters polling every 50ms is its own little load. And there is wasted latency, if the work finishes 1ms after your last check, you still sit idle until your next 50ms tick.</p>

<p>This is where <strong>pub/sub</strong> is much nicer. Instead of everyone repeatedly asking “is it ready yet?”, the waiters <strong>subscribe</strong> to a channel for that key and go quiet. When the one worker finishes, it <strong>publishes</strong> a message on that channel. Every waiting request wakes up at that exact moment and reads the now filled value.</p>

<div class="language-js highlighter-rouge"><div class="highlight"><pre class="highlight"><code><table class="rouge-table"><tbody><tr><td class="rouge-gutter gl"><pre class="lineno">1
2
3
4
5
6
7
8
9
10
11
12
13
14
</pre></td><td class="rouge-code"><pre><span class="c1">// the worker, after it fills the cache:</span>
<span class="k">await</span> <span class="nx">redis</span><span class="p">.</span><span class="nf">set</span><span class="p">(</span><span class="nx">key</span><span class="p">,</span> <span class="nx">JSON</span><span class="p">.</span><span class="nf">stringify</span><span class="p">(</span><span class="nx">post</span><span class="p">),</span> <span class="dl">"</span><span class="s2">EX</span><span class="dl">"</span><span class="p">,</span> <span class="mi">60</span><span class="p">);</span>
<span class="k">await</span> <span class="nx">redis</span><span class="p">.</span><span class="nf">publish</span><span class="p">(</span><span class="s2">`ready:</span><span class="p">${</span><span class="nx">key</span><span class="p">}</span><span class="s2">`</span><span class="p">,</span> <span class="dl">"</span><span class="s2">done</span><span class="dl">"</span><span class="p">);</span> <span class="c1">// wake everyone up</span>
<span class="k">await</span> <span class="nx">redis</span><span class="p">.</span><span class="nf">del</span><span class="p">(</span><span class="nx">lockKey</span><span class="p">);</span>

<span class="c1">// a waiter:</span>
<span class="k">async</span> <span class="kd">function</span> <span class="nf">waitForResult</span><span class="p">(</span><span class="nx">key</span><span class="p">)</span> <span class="p">{</span>
  <span class="kd">const</span> <span class="nx">cached</span> <span class="o">=</span> <span class="k">await</span> <span class="nx">redis</span><span class="p">.</span><span class="nf">get</span><span class="p">(</span><span class="nx">key</span><span class="p">);</span>
  <span class="k">if </span><span class="p">(</span><span class="nx">cached</span><span class="p">)</span> <span class="k">return</span> <span class="nx">JSON</span><span class="p">.</span><span class="nf">parse</span><span class="p">(</span><span class="nx">cached</span><span class="p">);</span> <span class="c1">// maybe it is already ready</span>

  <span class="k">await</span> <span class="nf">subscribeOnce</span><span class="p">(</span><span class="s2">`ready:</span><span class="p">${</span><span class="nx">key</span><span class="p">}</span><span class="s2">`</span><span class="p">);</span> <span class="c1">// sleep until the worker signals</span>
  <span class="kd">const</span> <span class="nx">value</span> <span class="o">=</span> <span class="k">await</span> <span class="nx">redis</span><span class="p">.</span><span class="nf">get</span><span class="p">(</span><span class="nx">key</span><span class="p">);</span>
  <span class="k">return</span> <span class="nx">JSON</span><span class="p">.</span><span class="nf">parse</span><span class="p">(</span><span class="nx">value</span><span class="p">);</span>
<span class="p">}</span>
</pre></td></tr></tbody></table></code></pre></div></div>

<div class="language-plaintext highlighter-rouge"><div class="highlight"><pre class="highlight"><code><table class="rouge-table"><tbody><tr><td class="rouge-gutter gl"><pre class="lineno">1
2
3
4
5
6
</pre></td><td class="rouge-code"><pre>                    ┌─────────────────────┐
   worker (1 req) ─►│  DB query + cache    │─► publish "ready:post:42"
                    └─────────────────────┘            │
                                                        ▼
   waiter  waiter  waiter  waiter  ... all subscribed, all wake up together
      └───────┴───────┴───────┴───── then read the value from Redis, once
</pre></td></tr></tbody></table></code></pre></div></div>

<p>No busy polling, no wasted Redis calls, and the waiters get the result the instant it is ready.</p>

<hr />

<h2 id="step-6-the-tradeoff-and-why-it-is-fine">Step 6: the tradeoff, and why it is fine</h2>

<p>Now the honest part. Have we actually made anything faster for the user? Not really. The waiting requests still have to wait for the first request to finish its database query. If that query takes 800ms, everyone waits roughly 800ms.</p>

<p>But here is the thing, and this is the whole point. That 800ms was going to be paid <strong>anyway</strong>. The data genuinely takes 800ms to produce. In the naive version, every one of the million requests paid its own 800ms <em>and</em> piled 800ms of load onto the database a million times over. In the coalesced version, everyone pays the <strong>same single</strong> 800ms, and the database does the work <strong>once</strong>.</p>

<p>So we did not remove the wait, we removed the <strong>duplication</strong>. One expensive operation instead of a million, and the user experience is identical, they were going to wait that long either way. That is a fantastic trade, because the cost we cut (database meltdown) is huge and the cost we kept (a wait that was unavoidable) is something we could not have avoided anyway.</p>

<hr />

<h2 id="the-sharp-edges-do-not-skip-these">The sharp edges (do not skip these)</h2>

<p>A few things that will bite you if you ship the simple version:</p>

<ul>
  <li><strong>The worker can die holding the lock.</strong> That is why the lock has a TTL (<code class="language-plaintext highlighter-rouge">EX 10</code>). If the holder crashes, the lock expires and another request can take over. Without a TTL, one crash locks that key forever.</li>
  <li><strong>Waiters need a timeout and a fallback.</strong> Never wait forever for a signal that might never come (the publish could be missed if you subscribe a hair too late). If the wait times out, fall back to doing the work yourself. Correctness first, coordination second.</li>
  <li><strong>There is a tiny race between subscribing and the publish.</strong> Always re-check the cache right after subscribing, in case the value landed in the gap. The snippet above does this.</li>
  <li><strong>Consider stale-while-revalidate.</strong> An even smoother pattern is to serve the slightly old value while one background request refreshes it. Then nobody waits at all, they just get data that is a few seconds stale. Great when a little staleness is acceptable, which for a viral read-heavy page it usually is.</li>
  <li><strong>Add jitter to your TTLs.</strong> If a lot of keys share the exact same expiry, they all stampede at the same second. A little randomness in the TTL spreads the misses out.</li>
</ul>

<hr />

<h2 id="wrapping-up">Wrapping up</h2>

<p>The chain of reasoning is the nice part here, so let me lay it out one more time:</p>

<ol>
  <li>A million requests want the same data, so put <strong>Redis</strong> in front and most of them are served from cache.</li>
  <li>But at a cold start or the moment the key <strong>expires</strong>, they all miss together and <strong>stampede</strong> the database, and duplicated writes and inserts are even worse than reads.</li>
  <li>So use <strong>single flight</strong>, only one request does the real work. In one process a promise map is enough.</li>
  <li>Across many pods, coordinate with a <strong>Redis lock</strong> (<code class="language-plaintext highlighter-rouge">SET NX EX</code>) so exactly one request in the whole cluster does the work.</li>
  <li>Let the other requests <strong>wait</strong>, and use <strong>pub/sub</strong> instead of polling so they wake up the instant the result is ready.</li>
  <li>The wait was unavoidable anyway, so the real win is turning a million expensive operations into <strong>one</strong>.</li>
</ol>

<p>None of this is exotic. It is just Redis being used as a coordination point and not only as a cache, which is a theme worth internalizing. If you want, I have a separate deep dive on <a href="/posts/REDIS-IN-AND-OUT/">how Redis actually works on the inside</a>, single thread, expiry, pub/sub and all, which pairs well with this one.</p>

<p>If you have used a different approach for cache stampedes, tell me in the comments, I would like to hear it.</p>]]></content><author><name>Amar Khamkar</name></author><category term="BACKEND" /><category term="LEARNINGS" /><category term="redis" /><category term="caching" /><category term="system-design" /><category term="request-coalescing" /><category term="distributed-systems" /><category term="backend" /><summary type="html"><![CDATA[A post about the cache stampede problem. When a hot post goes viral and a million people ask for the same data at the same second, even a Redis cache in front of the database is not enough. This walks through single flight, the Redis lock, and using pub/sub so all the waiting requests get the result the moment the first one finishes.]]></summary><media:thumbnail xmlns:media="http://search.yahoo.com/mrss/" url="https://blog.amarkhamkar.com/assets/img/request-coalescing/request-coalescing-dark.png" /><media:content medium="image" url="https://blog.amarkhamkar.com/assets/img/request-coalescing/request-coalescing-dark.png" xmlns:media="http://search.yahoo.com/mrss/" /></entry><entry><title type="html">MySQL Internals: Pages, B+Trees, Indexes, the Optimizer, WAL, Binlog and Replication</title><link href="https://blog.amarkhamkar.com/posts/mysql-internals/" rel="alternate" type="text/html" title="MySQL Internals: Pages, B+Trees, Indexes, the Optimizer, WAL, Binlog and Replication" /><published>2026-08-13T18:30:00+00:00</published><updated>2026-08-13T18:30:00+00:00</updated><id>https://blog.amarkhamkar.com/posts/mysql-internals</id><content type="html" xml:base="https://blog.amarkhamkar.com/posts/mysql-internals/"><![CDATA[<p>We all use MySQL almost every day. We create a table, add a few indexes, write some queries, and it just works. But most of us never stop to ask what is actually happening when we run <code class="language-plaintext highlighter-rouge">SELECT * FROM users WHERE id = 42</code>. How does it find that one row out of ten million, and how does it make sure the row is still there after a crash?</p>

<p>Let me go top to bottom through MySQL, or more correctly InnoDB, the storage engine almost everyone uses. We start from the smallest unit on disk, the page, and build up to B+Tree indexes, clustered vs secondary indexes, how the optimizer decides whether to even use an index, when a normal index fails and you reach for spatial indexing, and finally how WAL, the binlog and replication keep everything durable and copied. By the end it should read as one connected story, not a bag of features.</p>

<hr />

<h2 id="the-page-the-unit-of-everything">The page: the unit of everything</h2>

<p>Before indexes and trees, there is one idea that everything else sits on top of, the <strong>page</strong>.</p>

<p>(Quick word on InnoDB, since I keep saying it. InnoDB is MySQL’s default storage engine, the part that actually stores rows on disk and handles indexes, transactions and crash recovery. When people say “MySQL internals” today, they almost always mean InnoDB.)</p>

<p>InnoDB does not read or write single rows from the disk. It reads and writes in fixed size blocks called pages, and by default a page is <strong>16 KB</strong>. Even if you want one small row, InnoDB pulls the whole 16 KB page that contains it into memory.</p>

<p>Why work in blocks like this? Because disk access is slow and it is slow in a very specific way. The expensive part is finding the data (the seek), not reading a bit more once you are there. So reading one row and reading 16 KB around it costs almost the same. It is much cheaper to read a decent block once than to go back to the disk again and again for tiny pieces.</p>

<p>These pages live on disk, but the hot ones are cached in memory in something called the <strong>buffer pool</strong>. The buffer pool is just a big chunk of RAM where InnoDB keeps the pages it is using. When you query a row, InnoDB first checks if its page is already in the buffer pool. If yes, no disk access at all. If not, it reads the page from disk into the buffer pool and then uses it. This is why the second run of the same query is often much faster than the first.</p>

<h3 id="what-one-page-actually-holds">What one page actually holds</h3>

<p>A page is not just a bag of rows. Crack one open and you find, top to bottom:</p>

<ul>
  <li>a small <strong>header</strong> — what page this is, its type, and pointers to the previous and next page at the same level (this is what chains the leaves together),</li>
  <li>the <strong>rows themselves</strong>, kept in key order as a linked list; on a clustered-index leaf each row also carries two hidden fields, <code class="language-plaintext highlighter-rouge">DB_TRX_ID</code> and <code class="language-plaintext highlighter-rouge">DB_ROLL_PTR</code>, which are what make MVCC and rollback work,</li>
  <li>some <strong>free space</strong> that new rows grow into,</li>
  <li>a tiny <strong>page directory</strong> — a few slots pointing into the rows, so a lookup <em>inside</em> the page is a binary search and not a linear scan,</li>
  <li>and a <strong>trailer</strong> with a checksum, to catch a page that was only half written before a crash.</li>
</ul>

<p>You do not need to memorise the layout. The one thing worth keeping is that a page is a self-contained little unit: its rows in sorted order, plus pointers to its neighbours. That is exactly what lets the tree on top of it work.</p>

<p>So the mental model to carry for the rest of this post is simple. <strong>The database is a pile of 16 KB pages, some on disk and some cached in memory, and almost everything is about reading as few pages as possible.</strong></p>

<hr />

<h2 id="how-the-data-is-arranged-b-tree-then-btree">How the data is arranged: B-Tree, then B+Tree</h2>

<p>Now, if the table is just a pile of pages, how do we find the right page quickly? If we had to scan every page to find <code class="language-plaintext highlighter-rouge">id = 42</code>, a large table would be painfully slow. This is the whole reason indexes exist, and the data structure behind them is the <strong>B+Tree</strong>.</p>

<p>Let me build up to it, because the “B+” part actually matters.</p>

<h3 id="first-the-b-tree">First, the B-Tree</h3>

<p>A B-Tree is a balanced tree made for disk. Unlike a normal binary tree where each node has 2 children, a B-Tree node can have <strong>many</strong> children, hundreds of them. Each node holds a bunch of sorted keys, and between those keys are pointers to child nodes.</p>

<p>Why so many children per node? This goes straight back to the page. One tree node is stored in one page. A page is 16 KB, and a single entry (one key plus a child pointer) is only a handful of bytes, so a node can hold hundreds of entries. This “how many children per node” number is called the <strong>fan out</strong>, and keeping the fan out high is the whole game.</p>

<p>A quick clarification, because this genuinely trips people up. The 16 in “16 KB page” is the page <strong>size</strong>, it is not the number of children. A node does not have 16 children, it has as many as physically fit in that 16 KB. For a typical integer key that is roughly <code class="language-plaintext highlighter-rouge">16 KB / (key + pointer)</code>, which lands somewhere around <strong>1000 children per node</strong> in practice (after row overhead, and because pages are not kept 100% full). So the fan out is in the hundreds to a thousand, not sixteen.</p>

<p>Now the height, which is the payoff. With a fan out of about 1000, the tree stays incredibly short:</p>

<div class="language-plaintext highlighter-rouge"><div class="highlight"><pre class="highlight"><code><table class="rouge-table"><tbody><tr><td class="rouge-gutter gl"><pre class="lineno">1
2
3
</pre></td><td class="rouge-code"><pre>height 1  →  ~1,000 rows
height 2  →  ~1,000,000 rows
height 3  →  ~1,000,000,000 rows
</pre></td></tr></tbody></table></code></pre></div></div>

<p>So even a table with hundreds of millions of rows is only <strong>3 or 4 levels deep</strong>. Since the height is exactly how many pages you must read to reach any row, that means any row is 3 or 4 page reads away, and the top one or two levels are almost always sitting in the buffer pool already. That is the magic. And because these trees are always kept <strong>balanced</strong> (every leaf at the same depth), that shallow number is not the best case, it is the worst case, the same for every single row.</p>

<p>Two things set that fan out, and both are levers you can feel. One is the <strong>page size</strong> — a 16 KB page simply fits more entries than a 4 KB one. The other is the <strong>size of each entry</strong> — a compact <code class="language-plaintext highlighter-rouge">INT</code> key with a small child pointer packs far tighter than a fat random <code class="language-plaintext highlighter-rouge">UUID</code>. Shrink the entry and the node gets wider, the tree gets flatter, and every lookup costs one fewer page read. That is a good part of why 16 KB is the default (flat tree, but reads still cheap) and why a small integer primary key is worth reaching for: both keep the fan out high.</p>

<p>Here is the catch with a plain B-Tree, and it is exactly what your fan out depends on. In a plain B-Tree, the <strong>data itself (the row, or the value) is stored inline in every node</strong>, including the internal ones. That data takes up space. So each entry becomes key + data + pointer, which is fat, and far fewer entries fit in the 16 KB page. Fewer entries per node means a lower fan out, a lower fan out means a <strong>taller</strong> tree, and a taller tree means <strong>more page reads</strong> for every lookup. The very thing that made the tree fast, packing lots of children into one page, gets spoiled by carrying data around in the internal nodes.</p>

<iframe src="https://simulation.amarkhamkar.com/b-tree/?embed=1" title="Interactive: B-Tree query traversal" loading="lazy" style="width:100%;height:520px;border:1px solid #d8dfe8;border-radius:12px"></iframe>

<p><em>Run a query on a B-Tree: every node stores rows, and there are no links between the bottom nodes. (<a href="https://simulation.amarkhamkar.com/b-tree/">open the B-Tree visualizer</a>)</em></p>

<script>
window.addEventListener("message",function(e){var d=e.data;if(!d||typeof d.mvh!=="number")return;var fr=document.querySelectorAll('iframe[src*="simulation.amarkhamkar.com"]');for(var i=0;i<fr.length;i++){if(fr[i].contentWindow===e.source){fr[i].style.height=(d.mvh+8)+"px";}}});
</script>

<h3 id="now-the-btree-what-databases-actually-use">Now, the B+Tree (what databases actually use)</h3>

<p>A B+Tree is a small but important variation:</p>

<ul>
  <li><strong>All the real data lives only in the leaf nodes</strong>, the bottom level. The internal nodes hold only keys and pointers, they act purely as a directory to guide you down.</li>
  <li><strong>The leaf nodes are linked together</strong> like a linked list, left to right in sorted order.</li>
</ul>

<p>These two changes give databases exactly what they need:</p>

<ul>
  <li><strong>Range queries become trivial.</strong> For <code class="language-plaintext highlighter-rouge">WHERE id BETWEEN 40 AND 90</code>, you walk down to the leaf holding 40 once, then just follow the leaf to leaf links to the right until you pass 90. No going back up the tree. A plain B-Tree cannot do this cleanly.</li>
  <li><strong>The internal nodes stay tiny</strong>, because they hold only keys and pointers, no data. This is the direct fix for the B-Tree problem above. With no data bloating them, far more entries fit in each 16 KB page, so the fan out is high again and the tree is short again. All the fat data sits down in the leaves, where it does not hurt the fan out of the directory above it.</li>
  <li><strong>Full ordered scans are just walking the leaf chain</strong> from left to right.</li>
</ul>

<p>So the one line summary is, MySQL stores your indexes (and as we will see, your table itself) as B+Trees, and a B+Tree is basically a very short, very wide tree, tuned so that finding any row takes only a handful of page reads.</p>

<iframe src="https://simulation.amarkhamkar.com/b-plus-tree/?embed=1" title="Interactive: B+Tree query traversal" loading="lazy" style="width:100%;height:540px;border:1px solid #d8dfe8;border-radius:12px"></iframe>

<p><em>The same query on a B+Tree: only the leaves store rows, and they are linked — so a range scan glides straight along the leaf chain. (<a href="https://simulation.amarkhamkar.com/b-plus-tree/">open the B+Tree visualizer</a>)</em></p>

<hr />

<h2 id="clustered-vs-secondary-index-this-is-the-part-people-miss">Clustered vs secondary index (this is the part people miss)</h2>

<p>Here is something that surprises a lot of people. In InnoDB, <strong>the table itself is a B+Tree</strong>. There is no separate “heap” of rows sitting somewhere with indexes pointing into it. The table <em>is</em> an index.</p>

<h3 id="the-clustered-index">The clustered index</h3>

<p>Every InnoDB table is physically stored as one big B+Tree, sorted by the <strong>primary key</strong>. This is called the <strong>clustered index</strong>. The leaf nodes of this tree do not just hold the key, they hold the <strong>entire row</strong>. So when you look up by primary key, you walk down the tree and the moment you reach the leaf, the full row is right there. One traversal, done.</p>

<p>This is also why the choice of primary key matters so much in InnoDB. Since the whole table is sorted and stored by it:</p>

<ul>
  <li>A small, ever increasing primary key (like an auto increment integer) is ideal. New rows just get appended to the end, pages fill up neatly.</li>
  <li>A large or random primary key (like a random UUID) is worse. Inserts land in random places in the tree, causing pages to split and fragment, and every secondary index gets bigger too (I will explain why in a second).</li>
</ul>

<p>If you do not define a primary key, InnoDB quietly creates a hidden one for you, so a clustered index always exists.</p>

<h3 id="the-secondary-index">The secondary index</h3>

<p>Now what about an index on some other column, say <code class="language-plaintext highlighter-rouge">email</code>? That is a <strong>secondary index</strong>. It is also a B+Tree, sorted by <code class="language-plaintext highlighter-rouge">email</code> this time. But here is the twist, its leaf nodes do <strong>not</strong> store the full row. They store the indexed column plus the <strong>primary key</strong> of that row.</p>

<p>So a lookup by <code class="language-plaintext highlighter-rouge">email</code> is actually <strong>two</strong> lookups:</p>

<div class="language-plaintext highlighter-rouge"><div class="highlight"><pre class="highlight"><code><table class="rouge-table"><tbody><tr><td class="rouge-gutter gl"><pre class="lineno">1
2
</pre></td><td class="rouge-code"><pre>1. Search the email B+Tree  ──►  find the leaf  ──►  it gives you the primary key
2. Search the clustered index by that primary key  ──►  finally get the full row
</pre></td></tr></tbody></table></code></pre></div></div>

<p>This second hop, from the secondary index back to the clustered index to fetch the rest of the row, is often called a <strong>bookmark lookup</strong> or “index back to table”. It is usually cheap, but it is not free, and it explains a couple of things:</p>

<ul>
  <li>Why secondary indexes store the primary key, and therefore why a fat primary key makes <em>every</em> secondary index fatter.</li>
  <li>Why a <strong>covering index</strong> is so nice. If your query only needs columns that are already inside the secondary index, InnoDB can answer it entirely from that index and skip the second hop completely. For example, an index on <code class="language-plaintext highlighter-rouge">(email, name)</code> can answer <code class="language-plaintext highlighter-rouge">SELECT name FROM users WHERE email = ?</code> without ever touching the clustered index. This is a very common and very effective optimization.</li>
</ul>

<p>So the picture is, one clustered index that <em>is</em> the table sorted by primary key, and any number of secondary indexes that point back to it using the primary key.</p>

<hr />

<h2 id="the-optimizer-should-it-even-use-the-index">The optimizer: should it even use the index?</h2>

<p>Here is a myth worth killing early. Adding an index does <strong>not</strong> guarantee it will be used. MySQL has a <strong>cost based optimizer</strong>, and for every query it estimates the cost of different plans and picks the cheapest one. Sometimes the cheapest plan is to <strong>ignore your index and just scan the whole table.</strong></p>

<p>That sounds wrong at first, but think about it with the page model.</p>

<p>Using a secondary index means, for each matching row, do a bookmark lookup back into the clustered index. Those lookups jump around the tree, so they are close to random page reads. A full table scan, on the other hand, reads the clustered index leaves in order, which is a nice sequential sweep.</p>

<p>Now imagine your query matches <strong>most</strong> of the table, for example <code class="language-plaintext highlighter-rouge">WHERE is_active = 1</code> where 90% of users are active. Using the index would mean doing a random bookmark lookup for 90% of all rows, which is far more expensive than just sweeping the table once in order. So the optimizer correctly chooses the full scan.</p>

<p>The idea behind this decision is <strong>selectivity</strong> (or cardinality). Selectivity is how many distinct values a column has, or put simply, how good the column is at narrowing things down:</p>

<ul>
  <li><strong>High selectivity</strong> (like <code class="language-plaintext highlighter-rouge">email</code>, almost unique) means an index lookup returns very few rows, so the index is a big win.</li>
  <li><strong>Low selectivity</strong> (like a <code class="language-plaintext highlighter-rouge">status</code> column with 3 possible values, or a boolean) means the index returns a huge chunk of the table, and past a certain tipping point the optimizer will skip it.</li>
</ul>

<p>How does the optimizer even know the selectivity without running the query? It keeps <strong>statistics</strong>, rough histograms and cardinality estimates for your columns, sampled from the pages. This is also why stale statistics can lead to bad plans, and why <code class="language-plaintext highlighter-rouge">ANALYZE TABLE</code> (to refresh stats) sometimes fixes a query that suddenly went slow.</p>

<p>The practical takeaways:</p>

<ul>
  <li>Do not index low selectivity columns on their own and expect magic. A boolean index is rarely useful by itself.</li>
  <li>Composite index order matters. Put the most selective, most equality filtered column first.</li>
  <li>Use <code class="language-plaintext highlighter-rouge">EXPLAIN</code> to see what the optimizer actually decided. If it says it is doing a full scan when you expected an index, the answer is usually selectivity or stale statistics, not a broken index.</li>
</ul>

<hr />

<h2 id="when-a-normal-scalar-index-fails">When a normal (scalar) index fails</h2>

<p>Everything so far assumes we are indexing a single <strong>scalar</strong> value that has a natural order, a number, a date, a string. B+Trees are perfect for that, because the whole idea of the tree is “keep the keys sorted in one dimension”.</p>

<p>But that single dimension assumption is exactly where B+Trees break down.</p>

<p>Think about location data, a <code class="language-plaintext highlighter-rouge">latitude</code> and a <code class="language-plaintext highlighter-rouge">longitude</code>, and a query like “find all restaurants within 2 km of me”. This is a <strong>two dimensional</strong> question. You care about latitude <em>and</em> longitude together.</p>

<p>Suppose you put a B+Tree index on <code class="language-plaintext highlighter-rouge">(latitude, longitude)</code>. The tree sorts primarily by latitude. So it can quickly narrow down “all points in this latitude band”, but within that band the longitudes are all over the place. To find a small 2 km box you would still have to scan a huge strip of the earth at the right latitude and filter longitude by hand. The index helps with one axis and is useless on the other.</p>

<p>The core problem is this. <strong>A B+Tree can only order data along one line. Space is not a line, it is a plane.</strong> There is no way to lay out 2D points on a single ordered line so that points near each other on the map are always near each other in the ordering. This is not a MySQL limitation, it is a property of the data structure, and to index space you need one that understands more than one dimension.</p>

<hr />

<h2 id="geospatial-indexing-quad-trees-and-r-trees">Geospatial indexing: quad-trees and R-trees</h2>

<p>The fix is to divide <strong>space</strong> itself instead of ordering values on a line.</p>

<h3 id="the-quad-tree-just-for-intuition">The quad-tree, just for intuition</h3>

<p>The easiest way to picture space partitioning is a <strong>quad-tree</strong>. Take the whole map as one square. If a square holds too many points, split it into <strong>four</strong> quadrants, and keep splitting the crowded ones. A city ends up finely split, an ocean stays one big square.</p>

<iframe src="https://simulation.amarkhamkar.com/quad-tree/?embed=1" title="Interactive: quad-tree location search" loading="lazy" style="width:100%;height:760px;border:1px solid #d8dfe8;border-radius:12px"></iframe>

<p><em>Drop a latitude/longitude and press Run — watch the grid keep splitting into the dense area. (<a href="https://simulation.amarkhamkar.com/quad-tree/">open the quadtree visualizer</a>)</em></p>

<p>“Find everything within 2 km of me” becomes a tree walk: start at the root and only descend into the squares that overlap your search box, skipping the rest of the map. That pruning is exactly what a scalar index could not do in 2D.</p>

<h3 id="what-mysql-actually-uses-the-r-tree">What MySQL actually uses: the R-tree</h3>

<p>A quad-tree is a great mental picture, but MySQL’s <code class="language-plaintext highlighter-rouge">SPATIAL</code> index (on <code class="language-plaintext highlighter-rouge">GEOMETRY</code>, <code class="language-plaintext highlighter-rouge">POINT</code> and similar) is built on an <strong>R-tree</strong>, not a quad-tree. An R-tree does not carve space up on a fixed grid. Instead it groups nearby <strong>objects</strong> together and stores a <strong>minimum bounding rectangle (MBR)</strong> around each group, the smallest box that encloses everything inside it. The leaves hold the actual geometries; the internal nodes hold boxes around boxes. To search, you start at the root and only walk down into the boxes that overlap your query box, pruning the rest.</p>

<iframe src="https://simulation.amarkhamkar.com/r-tree/?embed=1" title="Interactive: R-tree location search" loading="lazy" style="width:100%;height:760px;border:1px solid #d8dfe8;border-radius:12px"></iframe>

<p><em>The same location on an R-tree — far fewer boxes opened, and it stays shallow. (<a href="https://simulation.amarkhamkar.com/r-tree/">open the R-Tree visualizer</a>)</em></p>

<h3 id="quad-tree-vs-r-tree">Quad-tree vs R-tree</h3>

<p>Both prune space to answer “near me” queries, so why does a database reach for the R-tree? It comes down to what each one actually divides.</p>

<table>
  <thead>
    <tr>
      <th> </th>
      <th>Quad-tree</th>
      <th>R-tree</th>
    </tr>
  </thead>
  <tbody>
    <tr>
      <td>Divides</td>
      <td><strong>space</strong>, on a fixed grid</td>
      <td><strong>data</strong> — it groups the objects</td>
    </tr>
    <tr>
      <td>Regions</td>
      <td>disjoint, tile the plane, never overlap</td>
      <td>bounding boxes that <strong>can overlap</strong></td>
    </tr>
    <tr>
      <td>Balanced?</td>
      <td>no — deeper wherever points are dense</td>
      <td>yes — every leaf at the same depth</td>
    </tr>
    <tr>
      <td>Node shape</td>
      <td>always 4 children</td>
      <td>high fan-out, one node per page</td>
    </tr>
    <tr>
      <td>Natural home</td>
      <td>in memory (images, game maps)</td>
      <td>on disk, in a database</td>
    </tr>
  </tbody>
</table>

<p>The last two rows are the whole reason MySQL picks an R-tree. A quad-tree splits space blindly, so its depth follows the data, a dense city block pushes one branch very deep while an ocean stays shallow. That lopsided shape does not map neatly onto fixed-size disk pages. An R-tree instead splits an overflowing node to stay <strong>balanced</strong> and wide, exactly the short, page-per-node shape the rest of this post has been leaning on, so every leaf is the same few page reads from the root. That is what makes it a database index and not just a nice diagram.</p>

<p>The one price the R-tree pays for grouping data instead of tiling space is that its boxes <strong>can overlap</strong>. A quad-tree’s quadrants never overlap, so a search there follows a clean path down. In an R-tree, two sibling boxes can cover the same patch of map, so your query box might land inside several of them at once and the search has to walk down more than one branch. That is the trade for staying balanced and disk-friendly.</p>

<p>In practice you rarely touch any of this directly:</p>

<div class="language-sql highlighter-rouge"><div class="highlight"><pre class="highlight"><code><table class="rouge-table"><tbody><tr><td class="rouge-gutter gl"><pre class="lineno">1
2
3
4
5
6
7
</pre></td><td class="rouge-code"><pre><span class="c1">-- a spatial index on a POINT column</span>
<span class="k">ALTER</span> <span class="k">TABLE</span> <span class="n">places</span> <span class="k">ADD</span> <span class="n">SPATIAL</span> <span class="k">INDEX</span> <span class="p">(</span><span class="k">location</span><span class="p">);</span>

<span class="c1">-- "find places whose location is inside this box"</span>
<span class="k">SELECT</span> <span class="n">name</span>
<span class="k">FROM</span> <span class="n">places</span>
<span class="k">WHERE</span> <span class="n">MBRContains</span><span class="p">(</span><span class="o">@</span><span class="n">search_area</span><span class="p">,</span> <span class="k">location</span><span class="p">);</span>
</pre></td></tr></tbody></table></code></pre></div></div>

<p>So the takeaway: a B+Tree orders values along one line and is perfect for <code class="language-plaintext highlighter-rouge">=</code> and range queries on a single dimension, while an R-tree carves space into (possibly overlapping) boxes and is what you reach for the moment the question is really “near me” or “inside this region”. When a scalar index falls apart on location data, the R-tree is the tool you were missing.</p>

<hr />

<h2 id="durability-the-write-ahead-log-wal">Durability: the Write Ahead Log (WAL)</h2>

<p>We have covered how MySQL <em>finds</em> your data. Now the other half, how it does not <em>lose</em> your data when the power goes off mid write.</p>

<p>Here is the tension. All the changes happen on pages in the buffer pool, in memory. Writing those changed (dirty) pages back to disk immediately, for every single commit, would be terrible, because those page writes are scattered randomly across the file and random disk writes are slow. But if we keep changes only in memory and the server crashes, the changes are gone.</p>

<p>The way out is <strong>Write Ahead Logging</strong>, or WAL. The rule is simple:</p>

<blockquote>
  <p>Before a change is considered committed, write a small record of that change to a log first. Only then acknowledge the commit. The actual data pages can be flushed to disk later, lazily.</p>
</blockquote>

<p>In InnoDB this log is the <strong>redo log</strong> (the <code class="language-plaintext highlighter-rouge">ib_logfile</code> files). It works like this:</p>

<div class="language-plaintext highlighter-rouge"><div class="highlight"><pre class="highlight"><code><table class="rouge-table"><tbody><tr><td class="rouge-gutter gl"><pre class="lineno">1
2
3
4
5
6
</pre></td><td class="rouge-code"><pre>COMMIT
  1. Change the page in the buffer pool (in memory)         [fast]
  2. Append what changed to the redo log, then fsync it     [fast, sequential]
  3. Acknowledge the commit to the client                   [done]
  ...later...
  4. Flush the dirty page to its real place on disk         [lazy, batched]
</pre></td></tr></tbody></table></code></pre></div></div>

<p>The important trick is that the redo log is written <strong>sequentially</strong>, appended to the end. Sequential disk writes are dramatically faster than random ones. So instead of doing slow random page writes on every commit, InnoDB does one fast sequential log append on commit, and pushes the slow random page writes to the background where they can be batched.</p>

<p>Now the crash safety. If the server dies after step 2 but before step 4, the data page on disk is stale, but the change is safely in the redo log. On restart, InnoDB does <strong>crash recovery</strong>: it reads the redo log and replays any changes that had not yet made it to the data pages. So a committed transaction survives even though its page was never written. The redo log is a fixed size ring that is reused in a circle, since once a dirty page is safely flushed, its old log records are no longer needed.</p>

<p>There is a matching <strong>undo log</strong> as well, which stores the previous version of rows. It is used to roll back a transaction that did not commit, and to give other transactions a consistent older snapshot to read (this is how MVCC and consistent reads work). But the one big idea to hold onto is WAL: <strong>log the change first, flush the pages later, replay the log after a crash.</strong></p>

<hr />

<h2 id="the-binlog-and-how-it-is-different-from-the-redo-log">The binlog, and how it is different from the redo log</h2>

<p>Here is a point that confuses almost everyone the first time, because MySQL has <strong>two</strong> logs that sound similar but do completely different jobs.</p>

<p>The <strong>redo log</strong> we just saw is an InnoDB, storage engine level thing. It is <strong>physical</strong> (“page 5 byte 100 changed to this”), it is circular (overwritten once flushed), and its only purpose is crash recovery. Nobody outside InnoDB reads it.</p>

<p>The <strong>binlog</strong> (binary log) is a <strong>server level</strong> log, above the storage engine. It records the changes as <strong>logical events</strong>, and it is <strong>append only</strong>, kept around for as long as you configure. Its purpose is completely different, it is for:</p>

<ul>
  <li><strong>Replication</strong>, shipping changes to replica servers (the big one).</li>
  <li><strong>Point in time recovery</strong>, restore last night’s backup, then replay the binlog up to 2 seconds before the bad <code class="language-plaintext highlighter-rouge">DELETE</code>.</li>
</ul>

<p>The binlog can be in different formats:</p>

<ul>
  <li><strong>STATEMENT</strong> based, it logs the actual SQL (<code class="language-plaintext highlighter-rouge">UPDATE users SET ...</code>). Compact, but risky for non deterministic statements (think <code class="language-plaintext highlighter-rouge">NOW()</code> or <code class="language-plaintext highlighter-rouge">RAND()</code>).</li>
  <li><strong>ROW</strong> based, it logs the actual before and after of each changed row. Safer and the common default today, at the cost of more log volume.</li>
  <li><strong>MIXED</strong>, use statement where safe, fall back to row where not.</li>
</ul>

<p>Because there are two logs, a commit has to make sure they agree, otherwise after a crash the redo log and the binlog could disagree about whether a transaction happened, and a replica would drift from the primary. InnoDB solves this with an internal <strong>two phase commit</strong> between the redo log and the binlog: prepare in the redo log, write the binlog, then mark the redo log committed. If a crash happens in the middle, recovery uses the presence of the binlog entry to decide whether to roll the transaction forward or back, so both logs always end up telling the same story.</p>

<p>Quick way to remember the two:</p>

<ul>
  <li><strong>Redo log</strong>, InnoDB, physical, circular, for surviving a crash.</li>
  <li><strong>Binlog</strong>, server layer, logical, append only, for replication and recovery.</li>
</ul>

<hr />

<h2 id="replication-copying-the-data-to-other-servers">Replication: copying the data to other servers</h2>

<p>Now the binlog pays off. Once you have a log of every change in commit order, you can hand that stream to another server and have it apply the same changes, and now you have a <strong>replica</strong> that stays in sync with the <strong>primary</strong>.</p>

<p>The basic flow:</p>

<div class="language-plaintext highlighter-rouge"><div class="highlight"><pre class="highlight"><code><table class="rouge-table"><tbody><tr><td class="rouge-gutter gl"><pre class="lineno">1
2
3
4
5
6
</pre></td><td class="rouge-code"><pre>   PRIMARY                                 REPLICA
 ┌──────────┐    binlog events    ┌────────────────────────┐
 │ writes   │ ──────────────────► │ I/O thread writes them  │
 │ + binlog │                     │ to a local relay log    │
 └──────────┘                     │ SQL thread replays them │
                                  └────────────────────────┘
</pre></td></tr></tbody></table></code></pre></div></div>

<p>The primary writes to its binlog as usual. Each replica has an I/O thread that pulls those binlog events over the network into a local <strong>relay log</strong>, and one or more SQL threads that replay the events to apply the exact same changes. The replica ends up with the same data.</p>

<p>The one tradeoff you must understand is <strong>how synchronous it is</strong>:</p>

<ul>
  <li><strong>Asynchronous</strong> (the default). The primary commits and tells the client “done” without waiting for any replica. Fast, but if the primary dies before a replica has caught up, those last few transactions can be lost. There is also a small <strong>replication lag</strong>, so a read from a replica can be a little behind the primary.</li>
  <li><strong>Semi synchronous.</strong> The primary waits until at least one replica has received (not necessarily applied) the change before acknowledging the commit. Safer against data loss on failover, slightly slower.</li>
  <li><strong>Group replication / fully synchronous</strong> setups go further and coordinate a group of nodes for stronger guarantees, at more cost and complexity.</li>
</ul>

<p>What replication buys you:</p>

<ul>
  <li><strong>Read scaling.</strong> Send heavy read traffic to replicas and keep the primary for writes. Just remember the lag, a value you wrote a moment ago might not be on the replica yet, so read your own writes from the primary when it matters.</li>
  <li><strong>High availability.</strong> If the primary dies, promote a replica to be the new primary (failover).</li>
  <li><strong>Backups and analytics</strong> off a replica, so you do not load the primary.</li>
</ul>

<p>This is also the exact same binlog machinery that tools like Debezium tap into for <strong>change data capture</strong>, streaming every row change out to systems like Kafka. So the humble binlog is not just for MySQL to MySQL replication, it is the source of truth for a whole world of downstream pipelines.</p>

<hr />

<h2 id="locking-optimistic-pessimistic-and-what-innodb-does-by-default">Locking: optimistic, pessimistic, and what InnoDB does by default</h2>

<p>The moment two people touch the same row at the same time, something has to decide who waits. There are two broad philosophies.</p>

<p><strong>Pessimistic locking</strong> assumes a clash is likely, so it locks the row up front and makes everyone else wait. In MySQL you ask for this with a locking read:</p>

<div class="language-sql highlighter-rouge"><div class="highlight"><pre class="highlight"><code><table class="rouge-table"><tbody><tr><td class="rouge-gutter gl"><pre class="lineno">1
2
3
</pre></td><td class="rouge-code"><pre><span class="c1">-- take an exclusive lock on the row until my transaction ends</span>
<span class="k">SELECT</span> <span class="o">*</span> <span class="k">FROM</span> <span class="n">accounts</span> <span class="k">WHERE</span> <span class="n">id</span> <span class="o">=</span> <span class="mi">7</span> <span class="k">FOR</span> <span class="k">UPDATE</span><span class="p">;</span>
<span class="c1">-- ...now update it safely; anyone else touching row 7 blocks until I commit</span>
</pre></td></tr></tbody></table></code></pre></div></div>

<p><code class="language-plaintext highlighter-rouge">FOR UPDATE</code> takes an exclusive lock, <code class="language-plaintext highlighter-rouge">FOR SHARE</code> a shared one, and the lock is held until you commit or roll back. Great when contention is real and transactions are short. The cost is that blocked transactions sit and wait, and if two of them wait on each other you get a <strong>deadlock</strong> (InnoDB detects it and kills one).</p>

<p><strong>Optimistic locking</strong> assumes clashes are rare, so it takes no lock at all. You read the row along with a <strong>version</strong> number (or an <code class="language-plaintext highlighter-rouge">updated_at</code>), do your work, and only at write time check that nobody changed it underneath you:</p>

<div class="language-sql highlighter-rouge"><div class="highlight"><pre class="highlight"><code><table class="rouge-table"><tbody><tr><td class="rouge-gutter gl"><pre class="lineno">1
2
</pre></td><td class="rouge-code"><pre><span class="k">UPDATE</span> <span class="n">accounts</span> <span class="k">SET</span> <span class="n">balance</span> <span class="o">=</span> <span class="mi">900</span><span class="p">,</span> <span class="k">version</span> <span class="o">=</span> <span class="k">version</span> <span class="o">+</span> <span class="mi">1</span>
<span class="k">WHERE</span> <span class="n">id</span> <span class="o">=</span> <span class="mi">7</span> <span class="k">AND</span> <span class="k">version</span> <span class="o">=</span> <span class="mi">42</span><span class="p">;</span>
</pre></td></tr></tbody></table></code></pre></div></div>

<p>If that <code class="language-plaintext highlighter-rouge">UPDATE</code> touches <strong>0 rows</strong>, someone else bumped the version first, so you re-read and retry. No waiting, no lock held across your think-time; the cost is the occasional retry. Note this is a pattern <em>you</em> build, a column plus a check, MySQL has no built-in optimistic mode (though ORMs like Rails and Hibernate ship a helper for it).</p>

<p><strong>So what does MySQL default to?</strong> InnoDB is <strong>pessimistic for writes</strong>. Every <code class="language-plaintext highlighter-rouge">UPDATE</code>, <code class="language-plaintext highlighter-rouge">DELETE</code> and <code class="language-plaintext highlighter-rouge">INSERT</code> automatically takes row-level locks on the rows it touches (and, under the default <code class="language-plaintext highlighter-rouge">REPEATABLE READ</code> isolation, gap / next-key locks to keep phantoms out) — you do not ask for it, it just happens, and it is lock-based, not version-based. Plain <code class="language-plaintext highlighter-rouge">SELECT</code>s are the happy exception: thanks to MVCC (the undo log from earlier), a normal read takes <strong>no lock</strong> and simply sees a consistent snapshot, so readers never block writers and writers never block readers. Optimistic locking is never automatic, if you want it you add the version column yourself.</p>

<hr />

<h2 id="putting-it-all-together">Putting it all together</h2>

<p>If I compress the whole journey into a few lines:</p>

<p>Everything sits on <strong>16 KB pages</strong>, read in blocks because disk seeks are the expensive part, and cached hot in the <strong>buffer pool</strong>. Data and indexes are stored as <strong>B+Trees</strong>, short and wide so any row is only a few page reads away, with linked leaves that make range scans cheap. The <strong>table itself is the clustered index</strong> sorted by primary key, and <strong>secondary indexes</strong> point back to it through the primary key, which is why covering indexes are so nice. The <strong>optimizer</strong> does not blindly use your index, it weighs selectivity and can prefer a full scan when an index would cause too many random lookups. A normal B+Tree only orders one dimension, so for “near me” location queries it fails, and you switch to a <strong>spatial (R-tree / quad-tree style) index</strong> that divides space into boxes. Durability comes from <strong>WAL</strong>, log the change to the redo log first and flush pages lazily, then replay the log after a crash. The <strong>binlog</strong> is a separate, logical, append only log that powers <strong>replication</strong> and point in time recovery, copying your data to replicas for read scaling and failover. And when two writers reach for the same row, <strong>row-level locks</strong> decide who waits, pessimistic by default, while MVCC lets plain reads skip locking altogether.</p>

<p>None of these are really separate features. They are all consequences of two simple facts, disk is slow and works in blocks, and memory is fast but not durable. Once you see MySQL through those two facts, most of its design stops being mysterious.</p>

<p>If you would rather poke at these ideas than read about them, I built a set of interactive <strong><a href="https://simulation.amarkhamkar.com/">data-structure simulators</a></strong> to go with this post: run a query through a <a href="https://simulation.amarkhamkar.com/b-tree/">B-Tree</a> and a <a href="https://simulation.amarkhamkar.com/b-plus-tree/">B+Tree</a>, or hand a latitude/longitude to a <a href="https://simulation.amarkhamkar.com/quad-tree/">quad-tree</a> and an <a href="https://simulation.amarkhamkar.com/r-tree/">R-Tree</a> and watch which one gets to you faster.</p>

<p>If you want me to go deeper into any one of these, MVCC and how reads stay consistent, or how <code class="language-plaintext highlighter-rouge">EXPLAIN</code> plans actually read, tell me in the comments and I will write a focused follow up.</p>]]></content><author><name>Amar Khamkar</name></author><category term="BACKEND" /><category term="LEARNINGS" /><category term="mysql" /><category term="database" /><category term="indexing" /><category term="b-tree" /><category term="innodb" /><category term="replication" /><category term="system-design" /><summary type="html"><![CDATA[A top to bottom walk through of how MySQL (InnoDB) actually works, from the page on disk, to B+Tree indexes, clustered vs secondary indexes, how the optimizer decides whether to even use an index, when a normal index fails and you need spatial indexing, and finally how WAL, the binlog and replication keep your data safe and copied.]]></summary></entry><entry><title type="html">Kafka Through a Real Use Case: Building an Uptime Monitoring Pipeline</title><link href="https://blog.amarkhamkar.com/posts/KAFKA-THROUGH-A-REAL-USE-CASE/" rel="alternate" type="text/html" title="Kafka Through a Real Use Case: Building an Uptime Monitoring Pipeline" /><published>2026-08-10T18:30:00+00:00</published><updated>2026-08-10T18:30:00+00:00</updated><id>https://blog.amarkhamkar.com/posts/KAFKA-THROUGH-A-REAL-USE-CASE</id><content type="html" xml:base="https://blog.amarkhamkar.com/posts/KAFKA-THROUGH-A-REAL-USE-CASE/"><![CDATA[<p>Kafka is one of those tools that sounds scarier than it is. Topics, partitions, brokers, consumer groups, offsets, the vocabulary alone can put you off. But once you tie it to a real problem, it clicks quite fast.</p>

<p>So in this post I want to do three things, in order. First explain the entities in plain words. Then look at a real, high scale use case, an <strong>uptime monitoring service</strong>. And finally, the part most tutorials skip, how do you actually decide the numbers, how many partitions, how many consumers, how many brokers, and how to set up the consumer group.</p>

<p>Here is the problem we will design for the whole way through.</p>

<blockquote>
  <p>We run an uptime monitoring service (think of something like Pingdom or UptimeRobot). We have <strong>10 million monitors</strong> in our database, each one is a URL or endpoint that we must check regularly, say <strong>every 5 minutes</strong>, to see if it is up. Each check is a slow outbound HTTP call. How do we fan this huge amount of work out across many worker machines, reliably, without hammering one box or losing checks?</p>
</blockquote>

<p>This is a textbook Kafka job. Let’s build up to it.</p>

<hr />

<h2 id="the-entities-in-plain-words">The entities, in plain words</h2>

<p>Think of Kafka as a <strong>durable log of events</strong> that many services can write to and read from. Here are the pieces, tied to our monitoring service.</p>

<ul>
  <li>
    <p><strong>Event (message)</strong>: a single record. For us, one “check job”, like <code class="language-plaintext highlighter-rouge">{"monitorId":123,"url":"https://acme.com/health"}</code>. Kafka does not care what is inside, it just stores the bytes.</p>
  </li>
  <li>
    <p><strong>Topic</strong>: a named stream of events, for us <code class="language-plaintext highlighter-rouge">health.checks</code>. Producers write to it, consumers read from it. A topic is really just an append only log.</p>
  </li>
  <li>
    <p><strong>Partition</strong>: the important one. A topic is split into one or more <strong>partitions</strong>, and each partition is an ordered, append only sequence of events. Partitions are how Kafka scales, because different partitions can live on different machines and be read in parallel. Order is guaranteed <strong>within</strong> a partition, not across partitions.</p>
  </li>
  <li>
    <p><strong>Offset</strong>: the position of an event inside a partition, just a number that keeps increasing. A consumer remembers “I have read up to offset 42 in partition 0”, and that is how it knows where to resume.</p>
  </li>
  <li>
    <p><strong>Broker</strong>: a single Kafka server. A broker holds some of the partitions and serves reads and writes for them. A <strong>cluster</strong> is a group of brokers working together.</p>
  </li>
  <li>
    <p><strong>Producer</strong>: whoever writes events into a topic. For us, the <strong>scheduler</strong> that decides which monitors are due and enqueues a check job for each. When it writes, it can pick a <strong>key</strong> (the monitor id), and Kafka uses that key to decide which partition the event goes to.</p>
  </li>
  <li>
    <p><strong>Consumer</strong>: whoever reads events and does the work. For us, a <strong>worker</strong> that takes a check job, makes the HTTP call, and records whether the site was up.</p>
  </li>
  <li>
    <p><strong>Consumer group</strong>: a set of consumers that share the work of reading a topic. Kafka gives <strong>each partition to exactly one consumer inside a group</strong>. So if the topic has 200 partitions and the group has 50 consumers, each consumer reads 4 partitions. Add more consumers and the work gets rebalanced. This is how we scale the workers horizontally, up to the number of partitions.</p>
  </li>
  <li>
    <p><strong>Replication</strong>: each partition can be copied to multiple brokers. One copy is the <strong>leader</strong> and the others are <strong>followers</strong> that stay in sync. If the broker holding the leader dies, a follower takes over, so we do not lose queued check jobs. The number of copies is the <strong>replication factor</strong> (3 is common in production).</p>
  </li>
</ul>

<hr />

<h2 id="the-use-case-designing-a-health-monitoring-system">The use case: designing a health monitoring system</h2>

<p>Let’s design a small <strong>uptime monitoring system</strong>, the kind of thing that watches a set of websites or endpoints and tells you the moment one goes down. A user adds the URLs they want watched, and the system’s job is to check each one on a schedule (say every 5 minutes), record whether it was up or down, and alert someone if it was down.</p>

<p>At a small scale you could do this with a cron job and a simple loop. The interesting part is scale. Imagine we are watching <strong>10 million monitors</strong>, each one due for a check every 5 minutes, and each check is a slow outbound HTTP call that can take a second or more. Now we have to spread that work across many machines, not lose any checks if a machine dies, and absorb the bursts when a lot of monitors fall due at the same instant. That combination, high fan-out, slow per item work, and no data loss, is exactly what Kafka is good at. So we will put Kafka at the center of the design.</p>

<p>Here is the shape of the pipeline.</p>

<div class="language-plaintext highlighter-rouge"><div class="highlight"><pre class="highlight"><code><table class="rouge-table"><tbody><tr><td class="rouge-gutter gl"><pre class="lineno">1
2
3
4
5
6
7
</pre></td><td class="rouge-code"><pre> Scheduler (producer)                         Worker pods (consumers)

  every tick, find monitors due  ──►  ┌────────────────┐  ──►  worker pulls a job
  publish one job per monitor    ──►  │  health.checks  │  ──►  makes the HTTP call
  (keyed by monitor id)               │  (Kafka topic,  │  ──►  records up / down in DB
                                       │   many partitions)│
                                       └────────────────┘
</pre></td></tr></tbody></table></code></pre></div></div>

<p>Two moving parts:</p>

<ul>
  <li>A <strong>scheduler</strong> (the producer) wakes up on each tick, queries the DB for monitors that are due for a check, and publishes <strong>one check job per monitor</strong> onto the <code class="language-plaintext highlighter-rouge">health.checks</code> topic. On a busy tick this can be hundreds of thousands of jobs at once.</li>
  <li>A pool of <strong>worker pods</strong> (the consumers, all in one group) read those jobs, make the actual HTTP call to each target, and write the result back.</li>
</ul>

<p>Why put Kafka in the middle instead of just having the scheduler call the workers directly?</p>

<ul>
  <li><strong>It absorbs bursts.</strong> If a tick dumps 300k jobs and the workers can only chew through them over the next couple of minutes, the jobs simply wait in the topic. Nothing is dropped, the workers just catch up.</li>
  <li><strong>It decouples scheduling from checking.</strong> The scheduler does not know or care how many workers exist. You can scale workers up and down freely.</li>
  <li><strong>It survives worker crashes.</strong> If a worker dies mid batch, those jobs are not lost, another worker picks them up from the last committed offset.</li>
  <li><strong>You can replay.</strong> If a bug made you record bad results for an hour, you can reset the offset and reprocess.</li>
</ul>

<p>Here is the <strong>producer</strong> (the scheduler), publishing jobs keyed by monitor id, using <code class="language-plaintext highlighter-rouge">kafkajs</code>:</p>

<div class="language-javascript highlighter-rouge"><div class="highlight"><pre class="highlight"><code><table class="rouge-table"><tbody><tr><td class="rouge-gutter gl"><pre class="lineno">1
2
3
4
5
6
7
8
9
10
11
12
13
14
</pre></td><td class="rouge-code"><pre><span class="kd">const</span> <span class="p">{</span> <span class="nx">Kafka</span> <span class="p">}</span> <span class="o">=</span> <span class="nf">require</span><span class="p">(</span><span class="dl">"</span><span class="s2">kafkajs</span><span class="dl">"</span><span class="p">);</span>

<span class="kd">const</span> <span class="nx">kafka</span> <span class="o">=</span> <span class="k">new</span> <span class="nc">Kafka</span><span class="p">({</span> <span class="na">clientId</span><span class="p">:</span> <span class="dl">"</span><span class="s2">scheduler</span><span class="dl">"</span><span class="p">,</span> <span class="na">brokers</span><span class="p">:</span> <span class="p">[</span><span class="dl">"</span><span class="s2">broker1:9092</span><span class="dl">"</span><span class="p">,</span> <span class="dl">"</span><span class="s2">broker2:9092</span><span class="dl">"</span><span class="p">]</span> <span class="p">});</span>
<span class="kd">const</span> <span class="nx">producer</span> <span class="o">=</span> <span class="nx">kafka</span><span class="p">.</span><span class="nf">producer</span><span class="p">();</span>

<span class="k">async</span> <span class="kd">function</span> <span class="nf">enqueueDueChecks</span><span class="p">(</span><span class="nx">dueMonitors</span><span class="p">)</span> <span class="p">{</span>
  <span class="k">await</span> <span class="nx">producer</span><span class="p">.</span><span class="nf">send</span><span class="p">({</span>
    <span class="na">topic</span><span class="p">:</span> <span class="dl">"</span><span class="s2">health.checks</span><span class="dl">"</span><span class="p">,</span>
    <span class="na">messages</span><span class="p">:</span> <span class="nx">dueMonitors</span><span class="p">.</span><span class="nf">map</span><span class="p">((</span><span class="nx">m</span><span class="p">)</span> <span class="o">=&gt;</span> <span class="p">({</span>
      <span class="na">key</span><span class="p">:</span> <span class="nc">String</span><span class="p">(</span><span class="nx">m</span><span class="p">.</span><span class="nx">id</span><span class="p">),</span>                       <span class="c1">// same monitor -&gt; same partition</span>
      <span class="na">value</span><span class="p">:</span> <span class="nx">JSON</span><span class="p">.</span><span class="nf">stringify</span><span class="p">({</span> <span class="na">monitorId</span><span class="p">:</span> <span class="nx">m</span><span class="p">.</span><span class="nx">id</span><span class="p">,</span> <span class="na">url</span><span class="p">:</span> <span class="nx">m</span><span class="p">.</span><span class="nx">url</span> <span class="p">}),</span>
    <span class="p">})),</span>
  <span class="p">});</span>
<span class="p">}</span>
</pre></td></tr></tbody></table></code></pre></div></div>

<p>And the <strong>worker</strong> (a consumer), doing the actual check and recording the result. Note the manual offset commit, more on that below:</p>

<div class="language-javascript highlighter-rouge"><div class="highlight"><pre class="highlight"><code><table class="rouge-table"><tbody><tr><td class="rouge-gutter gl"><pre class="lineno">1
2
3
4
5
6
7
8
9
10
11
12
13
14
15
16
17
18
19
20
21
22
23
24
</pre></td><td class="rouge-code"><pre><span class="kd">const</span> <span class="p">{</span> <span class="nx">Kafka</span> <span class="p">}</span> <span class="o">=</span> <span class="nf">require</span><span class="p">(</span><span class="dl">"</span><span class="s2">kafkajs</span><span class="dl">"</span><span class="p">);</span>

<span class="kd">const</span> <span class="nx">kafka</span> <span class="o">=</span> <span class="k">new</span> <span class="nc">Kafka</span><span class="p">({</span> <span class="na">clientId</span><span class="p">:</span> <span class="dl">"</span><span class="s2">health-worker</span><span class="dl">"</span><span class="p">,</span> <span class="na">brokers</span><span class="p">:</span> <span class="p">[</span><span class="dl">"</span><span class="s2">broker1:9092</span><span class="dl">"</span><span class="p">,</span> <span class="dl">"</span><span class="s2">broker2:9092</span><span class="dl">"</span><span class="p">]</span> <span class="p">});</span>
<span class="kd">const</span> <span class="nx">consumer</span> <span class="o">=</span> <span class="nx">kafka</span><span class="p">.</span><span class="nf">consumer</span><span class="p">({</span> <span class="na">groupId</span><span class="p">:</span> <span class="dl">"</span><span class="s2">health-workers</span><span class="dl">"</span> <span class="p">});</span>

<span class="k">async</span> <span class="kd">function</span> <span class="nf">start</span><span class="p">()</span> <span class="p">{</span>
  <span class="k">await</span> <span class="nx">consumer</span><span class="p">.</span><span class="nf">connect</span><span class="p">();</span>
  <span class="k">await</span> <span class="nx">consumer</span><span class="p">.</span><span class="nf">subscribe</span><span class="p">({</span> <span class="na">topic</span><span class="p">:</span> <span class="dl">"</span><span class="s2">health.checks</span><span class="dl">"</span><span class="p">,</span> <span class="na">fromBeginning</span><span class="p">:</span> <span class="kc">false</span> <span class="p">});</span>

  <span class="k">await</span> <span class="nx">consumer</span><span class="p">.</span><span class="nf">run</span><span class="p">({</span>
    <span class="na">autoCommit</span><span class="p">:</span> <span class="kc">false</span><span class="p">,</span> <span class="c1">// we commit ourselves, only after the check is done</span>
    <span class="na">eachMessage</span><span class="p">:</span> <span class="k">async </span><span class="p">({</span> <span class="nx">topic</span><span class="p">,</span> <span class="nx">partition</span><span class="p">,</span> <span class="nx">message</span> <span class="p">})</span> <span class="o">=&gt;</span> <span class="p">{</span>
      <span class="kd">const</span> <span class="p">{</span> <span class="nx">monitorId</span><span class="p">,</span> <span class="nx">url</span> <span class="p">}</span> <span class="o">=</span> <span class="nx">JSON</span><span class="p">.</span><span class="nf">parse</span><span class="p">(</span><span class="nx">message</span><span class="p">.</span><span class="nx">value</span><span class="p">.</span><span class="nf">toString</span><span class="p">());</span>

      <span class="kd">const</span> <span class="nx">result</span> <span class="o">=</span> <span class="k">await</span> <span class="nf">runHealthCheck</span><span class="p">(</span><span class="nx">url</span><span class="p">);</span>   <span class="c1">// the slow HTTP call</span>
      <span class="k">await</span> <span class="nx">db</span><span class="p">.</span><span class="nx">results</span><span class="p">.</span><span class="nf">upsert</span><span class="p">({</span> <span class="nx">monitorId</span><span class="p">,</span> <span class="nx">result</span><span class="p">,</span> <span class="na">at</span><span class="p">:</span> <span class="nb">Date</span><span class="p">.</span><span class="nf">now</span><span class="p">()</span> <span class="p">});</span>

      <span class="c1">// only now do we move the bookmark forward</span>
      <span class="k">await</span> <span class="nx">consumer</span><span class="p">.</span><span class="nf">commitOffsets</span><span class="p">([</span>
        <span class="p">{</span> <span class="nx">topic</span><span class="p">,</span> <span class="nx">partition</span><span class="p">,</span> <span class="na">offset</span><span class="p">:</span> <span class="p">(</span><span class="nc">Number</span><span class="p">(</span><span class="nx">message</span><span class="p">.</span><span class="nx">offset</span><span class="p">)</span> <span class="o">+</span> <span class="mi">1</span><span class="p">).</span><span class="nf">toString</span><span class="p">()</span> <span class="p">},</span>
      <span class="p">]);</span>
    <span class="p">},</span>
  <span class="p">});</span>
<span class="p">}</span>
</pre></td></tr></tbody></table></code></pre></div></div>

<p>A couple of things to notice, and they matter a lot at this scale. I keyed jobs by <strong>monitor id</strong> so two overlapping checks for the same monitor cannot run out of order or in parallel on different workers. And recording the result is an <strong>upsert</strong>, because Kafka delivers “at least once”, so the same job can occasionally be processed twice, and doing it twice should be safe.</p>

<hr />

<h2 id="a-common-misconception-is-kafka-pubsub-or-a-message-queue">A common misconception: is Kafka pub/sub or a message queue?</h2>

<p>Worth clearing up, because it trips up almost everyone. People often say “Kafka is a pub/sub system, not a message queue.” That is only half right. Kafka is really a distributed <strong>log</strong>, and depending on how you use consumer groups it can behave as <strong>either</strong> one.</p>

<ul>
  <li><strong>Like a queue (competing consumers).</strong> Put all your consumers in the <strong>same</strong> group, and Kafka splits the partitions among them, so each message is handled by exactly one consumer in that group. That is a work queue, and it is exactly what our monitoring workers do, the check jobs get divided across the one <code class="language-plaintext highlighter-rouge">health-workers</code> group.</li>
  <li><strong>Like pub/sub (fan-out).</strong> Add a <strong>second</strong> consumer group on the same topic, and that group independently reads <strong>all</strong> the messages too. So the <code class="language-plaintext highlighter-rouge">health-workers</code> group can be doing the checks, while a separate <code class="language-plaintext highlighter-rouge">audit</code> group reads the same <code class="language-plaintext highlighter-rouge">health.checks</code> topic to log every job. Each group gets the full stream.</li>
</ul>

<p>The other thing that makes Kafka different from a classic queue like RabbitMQ or SQS, it does <strong>not delete a message when it is consumed</strong>. A traditional queue removes a message once a consumer acknowledges it. Kafka keeps every message for its retention period, and each consumer group just tracks its own offset. That is what lets multiple groups read the same data independently, and what lets you <strong>replay</strong> by rewinding an offset. In a classic queue, once a message is consumed, it is gone.</p>

<p>So the accurate way to say it is, <strong>Kafka is a log that gives you queue semantics within a group and pub/sub semantics across groups.</strong> Our monitoring design leans on the queue side.</p>

<hr />

<h2 id="now-the-real-question-how-do-you-pick-the-numbers">Now the real question: how do you pick the numbers?</h2>

<p>This is where most explanations stop, but it is the part that actually matters when you build it. Let’s start with the load.</p>

<ul>
  <li>10 million monitors, each checked every 5 minutes (300 seconds).</li>
  <li>So the pipeline must sustain <code class="language-plaintext highlighter-rouge">10,000,000 / 300 ≈ 33,000 checks per second</code>.</li>
</ul>

<p>Hold on to that number, <code class="language-plaintext highlighter-rouge">~33k/sec</code>. Everything below flows from it.</p>

<h3 id="producers">Producers</h3>

<p>On the producer side (the scheduler), three decisions matter.</p>

<ul>
  <li><strong>Partition key.</strong> Key every job by the <strong>monitor id</strong>. Kafka hashes the key to choose a partition, so all jobs for a given monitor land on the <strong>same partition</strong> and are processed in order by one worker. That stops two workers checking the same monitor at the same instant. (If you did not care about that, you could skip the key and let jobs spread evenly, but here keying is the safer choice.)</li>
  <li><strong>acks (durability).</strong> Set <code class="language-plaintext highlighter-rouge">acks=all</code> so a job is only acknowledged once the leader and its in sync replicas have it. You do not want to lose a batch of queued checks because a broker restarted.</li>
  <li><strong>Idempotent producer.</strong> Turn on <code class="language-plaintext highlighter-rouge">enable.idempotence=true</code> so an internal retry does not enqueue the same job twice.</li>
</ul>

<p>You do not need many producer instances, a single scheduler (or a small number) can push tens of thousands of small messages per second through a few connections.</p>

<h3 id="brokers-and-replication-factor">Brokers and replication factor</h3>

<p>A <strong>broker</strong> is one Kafka server, and your partitions physically live on brokers. The <strong>replication factor</strong> is how many copies of each partition Kafka keeps on <em>different</em> brokers for fault tolerance.</p>

<p>The rule that confuses people: <strong>your replication factor cannot exceed the number of brokers.</strong> The reason is simple once you see it, each copy of a partition has to sit on a <em>different</em> broker (two copies on the same machine would both die together, which defeats the point). So a replication factor of 3 needs at least 3 brokers.</p>

<p>For production you almost always want <strong>replication factor 3</strong> (plus <code class="language-plaintext highlighter-rouge">min.insync.replicas=2</code>), because then you can lose one entire broker and still have the data on two others and keep accepting writes.</p>

<p>Now bring in our numbers. Say we settle on <strong>200 partitions</strong> (why, in a second). With replication factor 3 that is <code class="language-plaintext highlighter-rouge">200 × 3 = 600</code> partition copies that have to be spread across the cluster. On a cluster of, say, <strong>6 brokers</strong>, that is about 100 partition copies per broker, comfortable. If you only had 3 brokers, each would carry all 200, which is heavier and leaves no room when one broker dies. So “more brokers” buys you two things, headroom for the replication factor, and spreading the partitions (and their load) across more machines. As an app team you usually do not own the broker count, you just make sure the cluster has enough brokers for RF 3 and your partition count.</p>

<h3 id="partitions-the-most-important-choice">Partitions (the most important choice)</h3>

<p>Partitions are your <strong>unit of parallelism</strong>, because a partition is read by only one consumer in a group. So the partition count is the ceiling on how many workers can run in parallel. This is the number to decide first.</p>

<p>Here is the key insight for this use case. Our messages are <strong>tiny</strong> (a monitor id and a URL, maybe 200 bytes), so at 33k/sec we are only moving about 6 MB/s, which is nothing for Kafka. The partition count here is <strong>not</strong> about byte throughput at all. It is about <strong>processing parallelism</strong>, because each job is a slow outbound HTTP call.</p>

<p>So size partitions by how much work one consumer can do:</p>

<div class="language-plaintext highlighter-rouge"><div class="highlight"><pre class="highlight"><code><table class="rouge-table"><tbody><tr><td class="rouge-gutter gl"><pre class="lineno">1
</pre></td><td class="rouge-code"><pre>partitions ≈ target rate / rate one consumer can handle
</pre></td></tr></tbody></table></code></pre></div></div>

<p>Say one worker keeps around 200 HTTP checks in flight and an average check (including slow and timing out ones) takes about a second. That is roughly <strong>200 checks/sec per worker</strong>. To hit 33k/sec:</p>

<div class="language-plaintext highlighter-rouge"><div class="highlight"><pre class="highlight"><code><table class="rouge-table"><tbody><tr><td class="rouge-gutter gl"><pre class="lineno">1
</pre></td><td class="rouge-code"><pre>33,000 / 200 ≈ 165 workers needed
</pre></td></tr></tbody></table></code></pre></div></div>

<p>So you want at least ~165 partitions, and you would round up with headroom to something like <strong>200 partitions</strong>. That headroom matters because increasing partitions later is possible but a bit painful (it changes how keys map to partitions).</p>

<p>This is the lesson worth stealing, <strong>when each message is slow to process, you need a lot of partitions even though the data volume is tiny.</strong> Partition count tracks your parallelism, not your bytes.</p>

<h3 id="consumers-and-the-consumer-group">Consumers and the consumer group</h3>

<p>All your workers share <strong>one consumer group</strong>, say <code class="language-plaintext highlighter-rouge">health-workers</code>. The single rule that governs everything:</p>

<div class="language-plaintext highlighter-rouge"><div class="highlight"><pre class="highlight"><code><table class="rouge-table"><tbody><tr><td class="rouge-gutter gl"><pre class="lineno">1
</pre></td><td class="rouge-code"><pre>number of consumers ≤ number of partitions
</pre></td></tr></tbody></table></code></pre></div></div>

<p>With 200 partitions you can run up to 200 worker consumers. Beyond 200 the extra ones just sit idle, they get no partition. So you would run something like <strong>20 worker pods with 10 consumer instances each</strong> (200 consumers total), or 40 pods of 5, whatever fits your pod sizing.</p>

<p><strong>Where do the consumers run?</strong> As their own <strong>worker deployment</strong>, separate from any API service. Spread the consumers across multiple pods so that if one pod dies, the others keep draining the topic (after a quick rebalance), and Kafka just redistributes that pod’s partitions to the survivors.</p>

<p><strong>How are partitions assigned, and what happens when a worker restarts?</strong> That is the assignment strategy and rebalancing, which get their own section next.</p>

<h3 id="a-sanity-check-on-the-things-downstream">A sanity check on the things downstream</h3>

<p>One trap, do not forget what the workers actually hit. At 33k checks/sec you are making 33k outbound HTTP calls per second and writing 33k results/sec to your database. Both can become the real bottleneck long before Kafka does. So batch the result writes, size your DB connection pools, and make sure the targets (and your own egress) can take that rate. It is worth doing this math early, because at this scale Kafka is rarely the part that falls over first.</p>

<hr />

<h2 id="auto-commit-vs-manual-commit">Auto-commit vs manual commit</h2>

<p>There is one consumer setting that quietly decides whether you lose work: when does the consumer <strong>commit its offset</strong>.</p>

<p>Committing an offset just means the consumer telling Kafka “I have processed up to here”, so that on a restart or rebalance it resumes from that point. There are two ways to do it.</p>

<ul>
  <li>
    <p><strong>Auto-commit</strong> (<code class="language-plaintext highlighter-rouge">enable.auto.commit=true</code>, the default in most clients): the client commits the latest <em>fetched</em> offsets automatically on a timer. Simple, but dangerous for us, because it commits based on what you <strong>pulled</strong>, not what you <strong>finished</strong>. If the timer commits a batch of jobs and then the worker crashes before the HTTP checks actually run, Kafka thinks those checks are done and they are silently never run. For a monitoring service, that means a monitor quietly stops being checked.</p>
  </li>
  <li>
    <p><strong>Manual commit</strong> (<code class="language-plaintext highlighter-rouge">enable.auto.commit=false</code>): you commit <strong>after</strong> the work succeeds, like in the worker code above. If the worker crashes after the check but before the commit, the job just runs again on restart (a duplicate), which is fine because recording the result is an idempotent upsert.</p>
  </li>
</ul>

<p>The rule of thumb, if losing a message is acceptable (metrics, low value logs), auto-commit is fine and simpler. If losing a message is not acceptable (a health check that must run, a payment, a sync), use manual commit and commit only after you have really done the work.</p>

<hr />

<h2 id="choosing-an-assignment-strategy-and-surviving-rebalances">Choosing an assignment strategy, and surviving rebalances</h2>

<p>Two things about consumer groups trip people up once real traffic hits, how partitions get assigned to consumers, and what happens every time the group changes.</p>

<h3 id="how-partitions-get-assigned">How partitions get assigned</h3>

<p>When consumers join a group, Kafka decides which consumer reads which partition. That decision is the <strong>assignment strategy</strong>:</p>

<ul>
  <li><strong>Range</strong> (the default): for each topic it hands out contiguous ranges of partitions to the consumers. Fine for a single topic like ours, but can get uneven when one group consumes several topics.</li>
  <li><strong>Round robin</strong>: spreads partitions one by one across all consumers, so the load is more even, which helps when a group subscribes to many topics.</li>
  <li><strong>Sticky / cooperative sticky</strong>: tries to keep each consumer on the partitions it already had, so a rebalance moves as few partitions as possible. On modern Kafka (2.4+), <strong>cooperative sticky</strong> is usually the best choice, especially with 200 consumers where a full reshuffle is expensive.</li>
</ul>

<h3 id="what-a-rebalance-is-and-why-it-can-hurt">What a rebalance is, and why it can hurt</h3>

<p>A <strong>rebalance</strong> is Kafka re dividing the partitions among the consumers whenever group membership changes, a worker joins, leaves, dies, or partitions are added.</p>

<p>The catch is the old <strong>eager, stop the world</strong> style, where on any change <strong>every</strong> consumer drops <strong>all</strong> its partitions and waits for a fresh assignment. With 200 workers, one pod restarting could briefly stall the entire fleet, and checks pile up. That is why the modern <strong>cooperative</strong> rebalancing matters, only the partitions that actually need to move are handed over, and everyone else keeps working.</p>

<h3 id="practical-tips-to-keep-rebalances-calm">Practical tips to keep rebalances calm</h3>

<ul>
  <li><strong>Keep the consumer count stable.</strong> Every scale event and crash is a rebalance, so do not autoscale workers aggressively on a spiky signal.</li>
  <li><strong>Tune the timeouts.</strong> Set <code class="language-plaintext highlighter-rouge">session.timeout.ms</code> and <code class="language-plaintext highlighter-rouge">heartbeat.interval.ms</code> so a short GC pause or a slow HTTP check does not get a healthy worker wrongly kicked out.</li>
  <li><strong>Use static membership.</strong> A stable <code class="language-plaintext highlighter-rouge">group.instance.id</code> per worker lets Kafka recognise a restarting pod as the same member, so a rolling deploy does not reshuffle all 200 partitions.</li>
  <li><strong>Shut down gracefully</strong> so a worker commits its offsets and leaves the group cleanly instead of timing out.</li>
</ul>

<hr />

<h2 id="a-few-gotchas-worth-knowing">A few gotchas worth knowing</h2>

<ul>
  <li><strong>Order is only per partition.</strong> Keying by monitor id keeps each monitor’s checks ordered, but there is no ordering across different monitors, which is exactly what we want here.</li>
  <li><strong>Make handlers idempotent.</strong> At least once delivery means a job can run twice. Upserting the result (rather than inserting) keeps that safe.</li>
  <li><strong>Watch consumer lag.</strong> Lag is how far behind the workers are from the newest offset. Growing lag here has a very concrete meaning, your monitors are being checked late. If lag climbs, you need more partitions and workers, or faster checks.</li>
  <li><strong>Handle poison jobs.</strong> A URL that always times out should not be retried forever and block a partition. Cap the retries and push it to a dead letter topic for later inspection.</li>
  <li><strong>Mind the downstream.</strong> At 33k/sec the HTTP targets and your database are the likely bottlenecks, not Kafka. Batch writes and pool connections.</li>
</ul>

<hr />

<h2 id="wrapping-up">Wrapping up</h2>

<p>If you strip Kafka down to one idea, it is this. A topic is a log, split into partitions, and <strong>partitions are your unit of parallelism</strong>. Almost every sizing decision flows from that. In our monitoring pipeline the whole design fell out of two numbers, 33k checks per second and about 200 checks per second per worker, which told us we needed roughly 200 partitions, up to 200 worker consumers spread across pods, on a cluster with enough brokers to hold replication factor 3.</p>

<p>And notice the theme that kept coming back, partitions track your <strong>processing parallelism</strong>, not your data volume. Our messages were tiny, but the work behind each one was slow, so we needed a lot of partitions. Get that one idea right and the rest of Kafka is mostly variations on it.</p>

<p>If you want, I can write a follow up on the scheduler side (how to avoid a thundering herd every tick), or on failure handling with retries and a dead letter topic. Tell me in the comments.</p>]]></content><author><name>Amar Khamkar</name></author><category term="BACKEND" /><category term="LEARNINGS" /><category term="kafka" /><category term="backend" /><category term="event-driven" /><category term="distributed-systems" /><category term="system-design" /><category term="work-queue" /><summary type="html"><![CDATA[A practical walk through of Kafka, first the entities in plain words, then a real high scale use case (an uptime monitoring service checking 10 million endpoints), and finally how to actually pick your partitions, consumers, brokers and consumer group.]]></summary><media:thumbnail xmlns:media="http://search.yahoo.com/mrss/" url="https://blog.amarkhamkar.com/assets/img/kafka/kafka-cheatsheet.png" /><media:content medium="image" url="https://blog.amarkhamkar.com/assets/img/kafka/kafka-cheatsheet.png" xmlns:media="http://search.yahoo.com/mrss/" /></entry><entry><title type="html">Redis In and Out: Single Threaded Speed, Expiry, Scripts, Sentinel and Cluster</title><link href="https://blog.amarkhamkar.com/posts/REDIS-IN-AND-OUT/" rel="alternate" type="text/html" title="Redis In and Out: Single Threaded Speed, Expiry, Scripts, Sentinel and Cluster" /><published>2026-08-07T18:30:00+00:00</published><updated>2026-08-07T18:30:00+00:00</updated><id>https://blog.amarkhamkar.com/posts/REDIS-IN-AND-OUT</id><content type="html" xml:base="https://blog.amarkhamkar.com/posts/REDIS-IN-AND-OUT/"><![CDATA[<p>Almost everyone has used Redis at some point, mostly as “that fast cache we put in front of the database”. But Redis is a lot more than a cache, and once you understand how it actually works on the inside, a lot of its design choices start making sense.</p>

<p>In this post I want to go in and out of Redis. How it stays this fast on a single thread, how it deletes expired keys in the background, how persistence works, what Lua scripting gives you, and finally the part that confuses most people, when to use Sentinel and when to use Cluster.</p>

<p>Let’s start from the very beginning.</p>

<hr />

<h2 id="what-is-redis-really">What is Redis, really</h2>

<p>Redis (REmote DIctionary Server) is an in memory data store. At its core it is basically a giant key value dictionary that lives in RAM, and that single fact explains most of its behaviour.</p>

<p>Because the data sits in memory and not on disk, reads and writes are extremely fast. A normal database has to go to the disk, deal with page caches, indexes and so on. Redis just looks up a key in an in memory hash table, which is an O(1) operation most of the time.</p>

<p>But Redis is not only strings. The values can be proper data structures:</p>

<ul>
  <li><strong>String</strong> for simple values, counters, JSON blobs</li>
  <li><strong>Hash</strong> for objects with fields, like a user record</li>
  <li><strong>List</strong> for queues and stacks</li>
  <li><strong>Set</strong> for unique items</li>
  <li><strong>Sorted Set (ZSet)</strong> for leaderboards and ranking, where each item has a score</li>
  <li>and a few special ones like <strong>Streams</strong>, <strong>Bitmaps</strong>, <strong>HyperLogLog</strong> and <strong>Geo</strong></li>
</ul>

<p>This is why people call Redis a “data structure server”. You are not just caching strings, you can push to a list, increment a counter or update a leaderboard, all on the server side and all atomic.</p>

<hr />

<h2 id="the-part-that-surprises-everyone-redis-is-single-threaded">The part that surprises everyone: Redis is single threaded</h2>

<p>Here is the fact that trips people up. The core of Redis that runs your commands is <strong>single threaded</strong>. One thread, processing one command at a time.</p>

<p>The first reaction is usually, “how can something single threaded be so fast in 2026 when my laptop has 10 cores?”. It feels backwards. But there are good reasons for it.</p>

<h3 id="why-single-threaded-actually-works-here">Why single threaded actually works here</h3>

<p><strong>The data is in memory, so the CPU is rarely the bottleneck.</strong> Most Redis commands are simple hash table operations that finish in microseconds. The real cost in a system like this is usually the network and memory, not the CPU doing the work. So adding more threads does not help as much as you would think.</p>

<p><strong>No locks, no race conditions.</strong> Because only one thread touches the data, Redis never has to lock anything. There is no risk of two threads corrupting the same key. This makes every single command <strong>atomic</strong> for free. When you run <code class="language-plaintext highlighter-rouge">INCR counter</code>, no other command can sneak in the middle of it. In a multi threaded design you would need locks everywhere, and locks bring their own slowness and bugs.</p>

<p><strong>No context switching.</strong> Threads constantly getting scheduled on and off the CPU is not free. A single thread doing tight, small operations avoids all of that overhead.</p>

<h3 id="but-then-how-does-it-handle-thousands-of-clients-at-once">But then how does it handle thousands of clients at once?</h3>

<p>This is the clever part. Redis uses an <strong>event loop</strong> with <strong>I/O multiplexing</strong> (<code class="language-plaintext highlighter-rouge">epoll</code> on Linux, <code class="language-plaintext highlighter-rouge">kqueue</code> on BSD/Mac). Instead of one thread per connection, a single thread watches all the connections and only wakes up for the ones that actually have data ready.</p>

<div class="language-plaintext highlighter-rouge"><div class="highlight"><pre class="highlight"><code><table class="rouge-table"><tbody><tr><td class="rouge-gutter gl"><pre class="lineno">1
2
3
4
5
6
7
8
9
10
11
12
</pre></td><td class="rouge-code"><pre>        many clients
   ┌────┬────┬────┬────┐
   │    │    │    │    │
   ▼    ▼    ▼    ▼    ▼
 ┌─────────────────────┐
 │   epoll / kqueue     │   "which sockets are ready?"
 └──────────┬──────────┘
            ▼
   ┌──────────────────┐
   │  single event     │   process one ready command,
   │  loop thread      │   then move to the next
   └──────────────────┘
</pre></td></tr></tbody></table></code></pre></div></div>

<p>So one thread can serve tens of thousands of open connections, because at any given moment it is only doing a tiny bit of work for whichever connection has a command ready.</p>

<blockquote>
  <p>A quick note on the word “client”, because it confused me at first. In Redis, a “client” just means a <strong>connection</strong>, one open socket. It is not per key, and it is not per application. Your app usually keeps a small <strong>connection pool</strong>, say 10 connections, and from Redis’s side that pool is 10 clients. Scale out to 40 app instances with 10 connections each, and Redis now sees 400 clients, all multiplexed by that one event loop thread. (The default limit is <code class="language-plaintext highlighter-rouge">maxclients 10000</code>, which is where the “tens of thousands” number comes from.) So one connection can read and write any number of keys, there is no such thing as a connection per key.</p>
</blockquote>

<blockquote>
  <p>One small note, because “Redis is single threaded” is only half true today. Since Redis 6 there is optional <strong>multi threaded I/O</strong>, where extra threads read and write the raw bytes from and to the sockets, and newer versions have made this more effective and turned it on more aggressively. But this only parallelises the network part. The actual command execution, the bit that touches your data, is still one thread. So the atomicity guarantee is exactly the same, no locks and no race conditions, you just get more help draining the sockets when the network is the bottleneck. So the honest one liner is, Redis runs your commands on a single thread, but it is no longer strictly single threaded end to end.</p>
</blockquote>

<hr />

<h2 id="how-redis-deletes-expired-keys">How Redis deletes expired keys</h2>

<p>This is one of my favourite parts, because it shows how the single threaded design shapes everything.</p>

<p>When you set a key with an expiry, like <code class="language-plaintext highlighter-rouge">SET session:123 abc EX 60</code>, Redis has to remove it after 60 seconds. The obvious way would be to run a timer for every key, but with millions of keys that would be very expensive. So Redis does something smarter, it uses <strong>two strategies together</strong>.</p>

<h3 id="1-lazy-passive-expiration">1. Lazy (passive) expiration</h3>

<p>When you try to access a key, Redis first checks if it has already expired. If yes, it deletes it right then and behaves as if the key does not exist.</p>

<p>This is cheap, but it has a problem. If a key expires and nobody ever touches it again, it will just sit there in memory forever, wasting space. So lazy expiration alone is not enough.</p>

<h3 id="2-active-expiration-the-background-process">2. Active expiration (the background process)</h3>

<p>This is the background job people usually do not know about. Redis runs a periodic task (part of its <code class="language-plaintext highlighter-rouge">serverCron</code>, roughly 10 times a second by default, controlled by the <code class="language-plaintext highlighter-rouge">hz</code> setting) that actively hunts for expired keys.</p>

<p>Each cycle it does roughly this:</p>

<div class="language-plaintext highlighter-rouge"><div class="highlight"><pre class="highlight"><code><table class="rouge-table"><tbody><tr><td class="rouge-gutter gl"><pre class="lineno">1
2
3
4
5
</pre></td><td class="rouge-code"><pre>1. Take a sample of ~20 random keys that have an expiry set.
2. Delete the ones that are already expired.
3. If more than 25% of the sample was expired,
   assume there are many more, and repeat immediately.
4. Otherwise stop for this cycle.
</pre></td></tr></tbody></table></code></pre></div></div>

<p>It is a probabilistic approach. Redis does not scan every key, that would be too slow. It samples, and if it keeps finding lots of expired keys it keeps going, otherwise it waits for the next cycle.</p>

<p>And here is where single threaded matters again. This cleanup runs on the <strong>same single thread</strong> that serves your commands. So Redis deliberately <strong>time boxes</strong> this work. It will not spend too long deleting keys in one cycle, because if it did, your normal commands would be blocked waiting behind it. It is a careful balance between reclaiming memory and staying responsive.</p>

<p><strong>What about under heavy traffic?</strong> Since this cleanup runs on the same main thread as your commands, it is fair to worry that it will steal time from real work during a spike. Redis guards against this by capping how long the active cycle is allowed to run each time (roughly a quarter of its small time budget), so your client commands never get starved by expiry work. The one case to watch out for is an “expiry storm”, where a very large number of keys all expire at the exact same instant. Those deletes still happen on the main thread, so they can cause a short latency spike. If you ever set the same TTL on millions of keys at once, it helps to add a little random jitter to the expiry so they do not all die together.</p>

<p>So the real answer to “how does Redis delete expired keys” is, a little bit lazily when you touch them, and a little bit actively in the background, always being careful not to block the main thread.</p>

<hr />

<h2 id="persistence-redis-is-in-memory-but-not-only-in-memory">Persistence: Redis is in memory, but not only in memory</h2>

<p>If everything is in RAM, what happens when the server restarts? By default you would lose all the data. That is why Redis has two persistence options.</p>

<h3 id="rdb-snapshots">RDB (snapshots)</h3>

<p>RDB takes a <strong>point in time snapshot</strong> of the whole dataset and writes it to a single file on disk (<code class="language-plaintext highlighter-rouge">dump.rdb</code>). You can configure it to snapshot every few minutes, or trigger it with <code class="language-plaintext highlighter-rouge">BGSAVE</code>.</p>

<p>The neat trick is how it avoids blocking. Redis <code class="language-plaintext highlighter-rouge">fork()</code>s a child process, and the child writes the snapshot while the parent keeps serving traffic. Thanks to copy on write memory in the OS, the child sees a frozen view of the data without actually copying all of it up front.</p>

<ul>
  <li>Good for backups and fast restarts.</li>
  <li>Downside, if the server crashes between two snapshots, you lose whatever changed in between.</li>
</ul>

<h3 id="aof-append-only-file">AOF (Append Only File)</h3>

<p>AOF logs every write command to a file. On restart, Redis replays the log to rebuild the dataset. You can control how often it flushes to disk with <code class="language-plaintext highlighter-rouge">appendfsync</code>:</p>

<ul>
  <li><code class="language-plaintext highlighter-rouge">always</code>, safest but slowest (flush on every write)</li>
  <li><code class="language-plaintext highlighter-rouge">everysec</code>, flush once a second, a good balance and the common choice</li>
  <li><code class="language-plaintext highlighter-rouge">no</code>, let the OS decide, fastest but least safe</li>
</ul>

<p>Since the log keeps growing, Redis periodically <strong>rewrites</strong> it into a compact form that represents the same final state.</p>

<h3 id="which-one">Which one?</h3>

<p>In practice, many people run <strong>both</strong>. Modern Redis even supports a hybrid file where an RDB snapshot is used as the base and AOF records the recent changes on top of it. RDB gives you fast restarts and backups, AOF gives you a much smaller window of possible data loss.</p>

<h3 id="what-happens-on-a-restart">What happens on a restart</h3>

<p>Since the data lives in memory, a restart has to <strong>load it back from disk first</strong>, either from the RDB snapshot or by replaying the AOF. This is not instant. The load time grows with the size of your dataset, so a few hundred MB comes back quickly, but many GB can take anywhere from seconds to a few minutes, and AOF replay is usually slower than loading an RDB snapshot. During that load the node is not serving traffic yet, so yes, there is a real cold start cost.</p>

<p>Two things are worth knowing here. In a Sentinel or Cluster setup, a replica keeps serving while one node restarts, so clients are not fully down. And if you run Redis as a <strong>pure cache with no persistence at all</strong>, a restart is instant, but the cache comes back <strong>empty</strong>, which can send a sudden flood of misses to your database (a “thundering herd”). So turning persistence off does not remove the restart cost, it just moves it onto your database.</p>

<h3 id="what-the-managed-services-hide">What the managed services hide</h3>

<p>If you are on AWS ElastiCache, GCP Memorystore, Redis Cloud, Railway, Upstash and so on, most of this RDB and AOF machinery is handled for you. You mostly just toggle things like “automatic backups” or “enable AOF” in a console, and replication and failover are managed too. It still runs underneath, and the choices still affect your durability and your cost, so it really helps to know what those toggles are actually doing.</p>

<hr />

<h2 id="lua-scripting-doing-many-things-atomically">Lua scripting: doing many things atomically</h2>

<p>So far we have looked at single commands. But sometimes you need a few commands to run together as one unit, and that is where scripting comes in. Redis lets you run <strong>Lua scripts</strong> on the server using <code class="language-plaintext highlighter-rouge">EVAL</code> (and <code class="language-plaintext highlighter-rouge">EVALSHA</code> for a cached script). The script runs on the server, right next to the data.</p>

<p>Why is this useful? Two reasons.</p>

<p><strong>Atomicity.</strong> Remember Redis is single threaded, so while your Lua script is running, nothing else runs. The whole script executes as one atomic unit. This is perfect for “read a value, decide something, then write” logic where you cannot afford another client to jump in the middle.</p>

<p><strong>Fewer round trips.</strong> Instead of sending five commands from your app and paying the network cost each time, you send one script that does all five on the server.</p>

<p>A fair question here, “but I am still calling <code class="language-plaintext highlighter-rouge">redis.call</code> five times inside the script, so how is that fewer round trips?”. The trick is <em>where</em> those calls happen. The network cost is between <strong>your app and Redis</strong>, not inside Redis. Five separate commands from your app means five round trips over the network. One <code class="language-plaintext highlighter-rouge">EVAL</code> is a <strong>single</strong> round trip, and the five <code class="language-plaintext highlighter-rouge">redis.call</code>s inside it run right inside the Redis process, in memory, with no network involved. So the number of <code class="language-plaintext highlighter-rouge">redis.call</code>s in the script does not cost you any network at all.</p>

<p>A classic example is an atomic rate limiter:</p>

<div class="language-lua highlighter-rouge"><div class="highlight"><pre class="highlight"><code><table class="rouge-table"><tbody><tr><td class="rouge-gutter gl"><pre class="lineno">1
2
3
4
5
6
7
8
9
</pre></td><td class="rouge-code"><pre><span class="c1">-- KEYS[1] = the rate limit key, ARGV[1] = limit, ARGV[2] = ttl seconds</span>
<span class="kd">local</span> <span class="n">current</span> <span class="o">=</span> <span class="n">redis</span><span class="p">.</span><span class="n">call</span><span class="p">(</span><span class="s2">"INCR"</span><span class="p">,</span> <span class="n">KEYS</span><span class="p">[</span><span class="mi">1</span><span class="p">])</span>
<span class="k">if</span> <span class="n">current</span> <span class="o">==</span> <span class="mi">1</span> <span class="k">then</span>
  <span class="n">redis</span><span class="p">.</span><span class="n">call</span><span class="p">(</span><span class="s2">"EXPIRE"</span><span class="p">,</span> <span class="n">KEYS</span><span class="p">[</span><span class="mi">1</span><span class="p">],</span> <span class="n">ARGV</span><span class="p">[</span><span class="mi">2</span><span class="p">])</span>
<span class="k">end</span>
<span class="k">if</span> <span class="n">current</span> <span class="o">&gt;</span> <span class="nb">tonumber</span><span class="p">(</span><span class="n">ARGV</span><span class="p">[</span><span class="mi">1</span><span class="p">])</span> <span class="k">then</span>
  <span class="k">return</span> <span class="mi">0</span>   <span class="c1">-- blocked</span>
<span class="k">end</span>
<span class="k">return</span> <span class="mi">1</span>     <span class="c1">-- allowed</span>
</pre></td></tr></tbody></table></code></pre></div></div>

<p>The increment, the expiry and the check all happen together, with no chance of another request slipping in between.</p>

<p>One important caution, because the script blocks the single thread, a <strong>slow Lua script blocks the entire server</strong>. So keep scripts short and never put slow loops in them. (Newer Redis also has <strong>Functions</strong> via the <code class="language-plaintext highlighter-rouge">FUNCTION</code> command, which is basically a more structured evolution of the same idea.)</p>

<hr />

<h2 id="making-redis-reliable-and-big-replication-sentinel-cluster">Making Redis reliable and big: replication, Sentinel, Cluster</h2>

<p>A single Redis node is great until it dies, or until your data no longer fits in one machine’s memory. This is where the interesting architecture decisions come in.</p>

<h3 id="replication-first">Replication first</h3>

<p>Redis supports <strong>replication</strong>, where one master node has one or more <strong>replicas</strong> that keep a copy of its data. Replication is asynchronous, the master keeps serving writes and streams the changes to the replicas.</p>

<p>Replicas are useful for two things, spreading out read traffic, and having a standby copy in case the master fails. But replication by itself does not give you automatic failover. If the master dies, someone (or something) still has to promote a replica. That is exactly the gap Sentinel fills.</p>

<h3 id="redis-sentinel-high-availability">Redis Sentinel: high availability</h3>

<p><strong>Sentinel</strong> is a separate process whose only job is to watch your Redis master and replicas and handle failover automatically.</p>

<div class="language-plaintext highlighter-rouge"><div class="highlight"><pre class="highlight"><code><table class="rouge-table"><tbody><tr><td class="rouge-gutter gl"><pre class="lineno">1
2
3
4
5
6
</pre></td><td class="rouge-code"><pre>        ┌───────────┐   monitors    ┌──────────┐
        │ Sentinel  │──────────────▶│  Master   │
        │ Sentinel  │──────────────▶│ Replica 1 │
        │ Sentinel  │──────────────▶│ Replica 2 │
        └───────────┘               └──────────┘
     (usually 3 sentinels for a proper quorum)
</pre></td></tr></tbody></table></code></pre></div></div>

<p>What it does:</p>

<ul>
  <li>Continuously checks if the master is alive.</li>
  <li>If a quorum of sentinels agree the master is down, they <strong>elect a replica and promote it to master</strong>.</li>
  <li>They update the other replicas to follow the new master.</li>
  <li>Clients ask Sentinel “who is the master right now?”, so they always connect to the correct node even after a failover.</li>
</ul>

<p>The key thing to understand about Sentinel, it gives you <strong>high availability, but not scaling</strong>. All your data still lives on one master. Sentinel just makes sure that if the master dies, a replica takes over quickly without a human waking up at 3am.</p>

<h3 id="redis-cluster-sharding-and-scaling">Redis Cluster: sharding and scaling</h3>

<p>Sentinel keeps one dataset alive. <strong>Cluster</strong> is for when the dataset itself is too big for one machine, or the write throughput is more than one node can handle.</p>

<p>Cluster <strong>shards</strong> the data across multiple master nodes. It splits the keyspace into <strong>16384 hash slots</strong>, and each master owns a range of those slots. The slot for a key is decided by a hash of the key, <code class="language-plaintext highlighter-rouge">CRC16(key) % 16384</code>.</p>

<div class="language-plaintext highlighter-rouge"><div class="highlight"><pre class="highlight"><code><table class="rouge-table"><tbody><tr><td class="rouge-gutter gl"><pre class="lineno">1
2
3
4
5
6
</pre></td><td class="rouge-code"><pre>      16384 hash slots, split across masters

   Master A            Master B            Master C
  slots 0-5460       slots 5461-10922    slots 10923-16383
     │                   │                   │
  Replica A           Replica B           Replica C
</pre></td></tr></tbody></table></code></pre></div></div>

<p>Some important points:</p>

<ul>
  <li>There is <strong>no central proxy</strong>. Clients are “cluster aware”. If you send a key to the wrong node, that node replies with a <code class="language-plaintext highlighter-rouge">MOVED</code> redirect telling you the right one, and a good client caches this map.</li>
  <li>Each master usually has its own replica, so Cluster also gives you high availability, not just scaling.</li>
  <li><strong>Multi key operations are limited.</strong> A command touching multiple keys only works if all those keys live in the same slot. You can force related keys into the same slot using a <strong>hash tag</strong>, like <code class="language-plaintext highlighter-rouge">{user:123}:profile</code> and <code class="language-plaintext highlighter-rouge">{user:123}:sessions</code>, where only the part inside <code class="language-plaintext highlighter-rouge">{}</code> is hashed.</li>
</ul>

<h3 id="the-throughput-this-unlocks">The throughput this unlocks</h3>

<p>This is worth saying plainly, because it is the reason Redis is reached for at scale. A single Redis node already does well over a hundred thousand operations per second. Once you shard with Cluster, throughput scales roughly linearly with the number of master nodes, so a real cluster comfortably handles <strong>millions, and up to the ten million operations per second range</strong>, of reads and writes.</p>

<p>A normal database simply cannot match this on its own. To get a relational database anywhere near that write throughput, you have to <strong>explicitly shard</strong> it yourself, split the data across many database servers, route every query to the right shard, and give up easy cross shard joins and transactions, all of which is a big, manual, error prone project. Redis was built around sharding from the start (those 16384 slots), so it hands you horizontal scale as a config choice rather than a re architecture. That combination, everything in memory plus near linear scaling with Cluster, is exactly why Redis sits in front of databases to soak up the traffic they cannot take directly. (If you want to see how this saves the database during a traffic spike, I wrote a separate post on <a href="/posts/REQUEST-COALESCING/">request coalescing and cache stampedes</a>.)</p>

<hr />

<h2 id="sentinel-or-cluster-how-to-actually-decide">Sentinel or Cluster: how to actually decide</h2>

<p>This is the decision people get stuck on, so let me make it simple. Ask yourself two questions.</p>

<p><strong>1. Does my data fit comfortably in one node’s RAM (with room to grow)?</strong>
<strong>2. Can one node handle my write throughput?</strong></p>

<ul>
  <li>
    <p>If <strong>yes to both</strong>, and you only want protection against the master dying, use <strong>Sentinel</strong>. It is simpler to run and reason about, and you keep all the multi key commands and transactions working normally, because everything is on one node.</p>
  </li>
  <li>
    <p>If <strong>no to either</strong>, meaning your data is too big for one machine or you need to scale writes horizontally, use <strong>Cluster</strong>. You get sharding across many masters, and each shard still has its own replica for HA.</p>
  </li>
</ul>

<p>A few practical notes:</p>

<ul>
  <li>Cluster is more complex to operate and it restricts multi key operations to a single slot. Do not reach for it just because it sounds more “scalable”. Complexity has a cost.</li>
  <li>If you are on a managed service like AWS ElastiCache, GCP Memorystore or Redis Cloud, a lot of this Sentinel vs Cluster machinery is handled for you, and you mostly just pick “replication” or “cluster mode” in a dropdown. But it helps a lot to know what is happening underneath.</li>
  <li>A common path is to start with a single node, add replicas plus Sentinel when you need HA, and move to Cluster only when you genuinely outgrow one machine.</li>
</ul>

<p>My honest rule of thumb, <strong>start with Sentinel, move to Cluster only when the data or the write load forces you to.</strong> Most applications never actually need Cluster.</p>

<hr />

<h2 id="where-redis-fits-common-use-cases">Where Redis fits (common use cases)</h2>

<p>Just so this does not stay too theoretical, here are the places I actually reach for Redis:</p>

<ul>
  <li><strong>Caching</strong>, the classic one, put it in front of a slow database or API.</li>
  <li><strong>Session store</strong>, store user sessions with a TTL so they expire on their own.</li>
  <li><strong>Rate limiting</strong>, using counters with expiry (the Lua example above).</li>
  <li><strong>Queues and background jobs</strong>, using lists or streams.</li>
  <li><strong>Leaderboards and ranking</strong>, using sorted sets.</li>
  <li><strong>Pub/Sub and real time</strong>, for chat, notifications and live updates.</li>
  <li><strong>Distributed locks</strong>, to coordinate work across many app servers.</li>
</ul>

<hr />

<h2 id="wrapping-up">Wrapping up</h2>

<p>If I had to compress the whole thing into a few lines, it would be this.</p>

<p>Redis is fast because the data lives in memory and one thread runs everything, which also makes every command atomic for free. It uses an event loop to serve thousands of clients on that one thread. It deletes expired keys partly lazily on access and partly through a careful background job that is time boxed so it never blocks you. It stays durable with RDB snapshots and the AOF log. Lua scripts let you run multi step logic atomically right next to the data. And when a single node is not enough, Sentinel keeps it alive and Cluster makes it bigger.</p>

<p>Once you see it this way, Redis stops feeling like a magic fast cache and starts feeling like a very well thought out piece of engineering, where almost every feature traces back to that one decision of keeping the core single threaded.</p>

<p>If there is any part you want me to go deeper into, tell me in the comments and I can write a follow up.</p>]]></content><author><name>Amar Khamkar</name></author><category term="BACKEND" /><category term="LEARNINGS" /><category term="redis" /><category term="backend" /><category term="caching" /><category term="distributed-systems" /><category term="sentinel" /><category term="cluster" /><category term="system-design" /><summary type="html"><![CDATA[A full walk through of Redis, how a single threaded server is this fast, how it deletes expired keys in the background, how persistence and Lua scripts work, and how to decide between Sentinel and Cluster.]]></summary><media:thumbnail xmlns:media="http://search.yahoo.com/mrss/" url="https://blog.amarkhamkar.com/assets/img/redis/redis-cheatsheet.png" /><media:content medium="image" url="https://blog.amarkhamkar.com/assets/img/redis/redis-cheatsheet.png" xmlns:media="http://search.yahoo.com/mrss/" /></entry><entry><title type="html">The Two Principles That Made Me Delete More Code Than I Write: YAGNI &amp;amp; KISS</title><link href="https://blog.amarkhamkar.com/posts/YAGNI-AND-KISS/" rel="alternate" type="text/html" title="The Two Principles That Made Me Delete More Code Than I Write: YAGNI &amp;amp; KISS" /><published>2026-07-20T18:30:00+00:00</published><updated>2026-07-20T18:30:00+00:00</updated><id>https://blog.amarkhamkar.com/posts/YAGNI-AND-KISS</id><content type="html" xml:base="https://blog.amarkhamkar.com/posts/YAGNI-AND-KISS/"><![CDATA[<p>Early in my career I used to measure a good day by how much code I wrote. More classes, more abstractions, more “flexibility for the future”, all of that felt like real progress.</p>

<p>A few years and a lot of maintenance pain later, I now measure a good day by how much code I <em>did not</em> write.</p>

<p>That shift comes down to two principles that sound almost too simple to matter, <strong>YAGNI</strong> and <strong>KISS</strong>. These are the first two things I look for in a code review, and also the hardest ones to actually follow, because both of them ask you to <em>do less</em>, and doing less feels like you are not trying hard enough.</p>

<p>Let’s break them down.</p>

<hr />

<h2 id="yagni-you-arent-gonna-need-it">YAGNI, You Aren’t Gonna Need It</h2>

<blockquote>
  <p>Build for the requirement in front of you, not for the future you are imagining.</p>
</blockquote>

<p>YAGNI says, add functionality only when it is actually needed, not when you think you will need it later. Every “just in case” feature is code that you have to write, test, document and maintain <em>forever</em>, and often for a future that never even arrives.</p>

<h3 id="you-are-probably-violating-yagni-when">You are probably violating YAGNI when…</h3>

<ul>
  <li>You catch yourself saying <em>“we might need to support X later”</em>, and you build X right now.</li>
  <li>You add a config flag that only ever has one value.</li>
  <li>You introduce an abstraction (an interface, a base class, a strategy) with exactly <strong>one</strong> implementation.</li>
  <li>There is a database column that nothing reads yet.</li>
</ul>

<h3 id="what-it-actually-costs-you">What it actually costs you</h3>

<p>The cost is not just the time to build that speculative thing. It is everything that comes after it:</p>

<ul>
  <li>The time to <strong>maintain and test</strong> the code that nobody uses.</li>
  <li>The extra <strong>complexity</strong> that every other engineer now has to read around.</li>
  <li>The <strong>bugs</strong> hiding inside code paths that never even run in production.</li>
</ul>

<p>Speculative generality is like a loan you take against your future self, and the interest rate is brutal.</p>

<h3 id="how-to-apply-it">How to apply it</h3>

<ul>
  <li>Ask yourself one question, <em>“is this needed for the story I am shipping today?”</em> If the answer is no, do not build it.</li>
  <li><strong>Delete</strong> the speculative code. <code class="language-plaintext highlighter-rouge">git</code> will remember it if you ever turn out to be right.</li>
  <li>Build the simple version now, and refactor when the real requirement actually lands.</li>
  <li>Follow the order, make it work, then make it right, then make it fast. Not the other way around.</li>
</ul>

<h3 id="yagni-is-not-an-excuse-for">YAGNI is <em>not</em> an excuse for</h3>

<p>This is where people misuse it. YAGNI kills <strong>speculative features</strong>, it does not kill <strong>good engineering</strong>. It is never a reason to skip error handling, or ignore security, or write code that is genuinely impossible to extend later. Simplicity and sloppiness are two very different things.</p>

<p><img src="/assets/img/design-principles/yagni.png" alt="YAGNI cheatsheet" />
<em>Save this one for your next code review.</em></p>
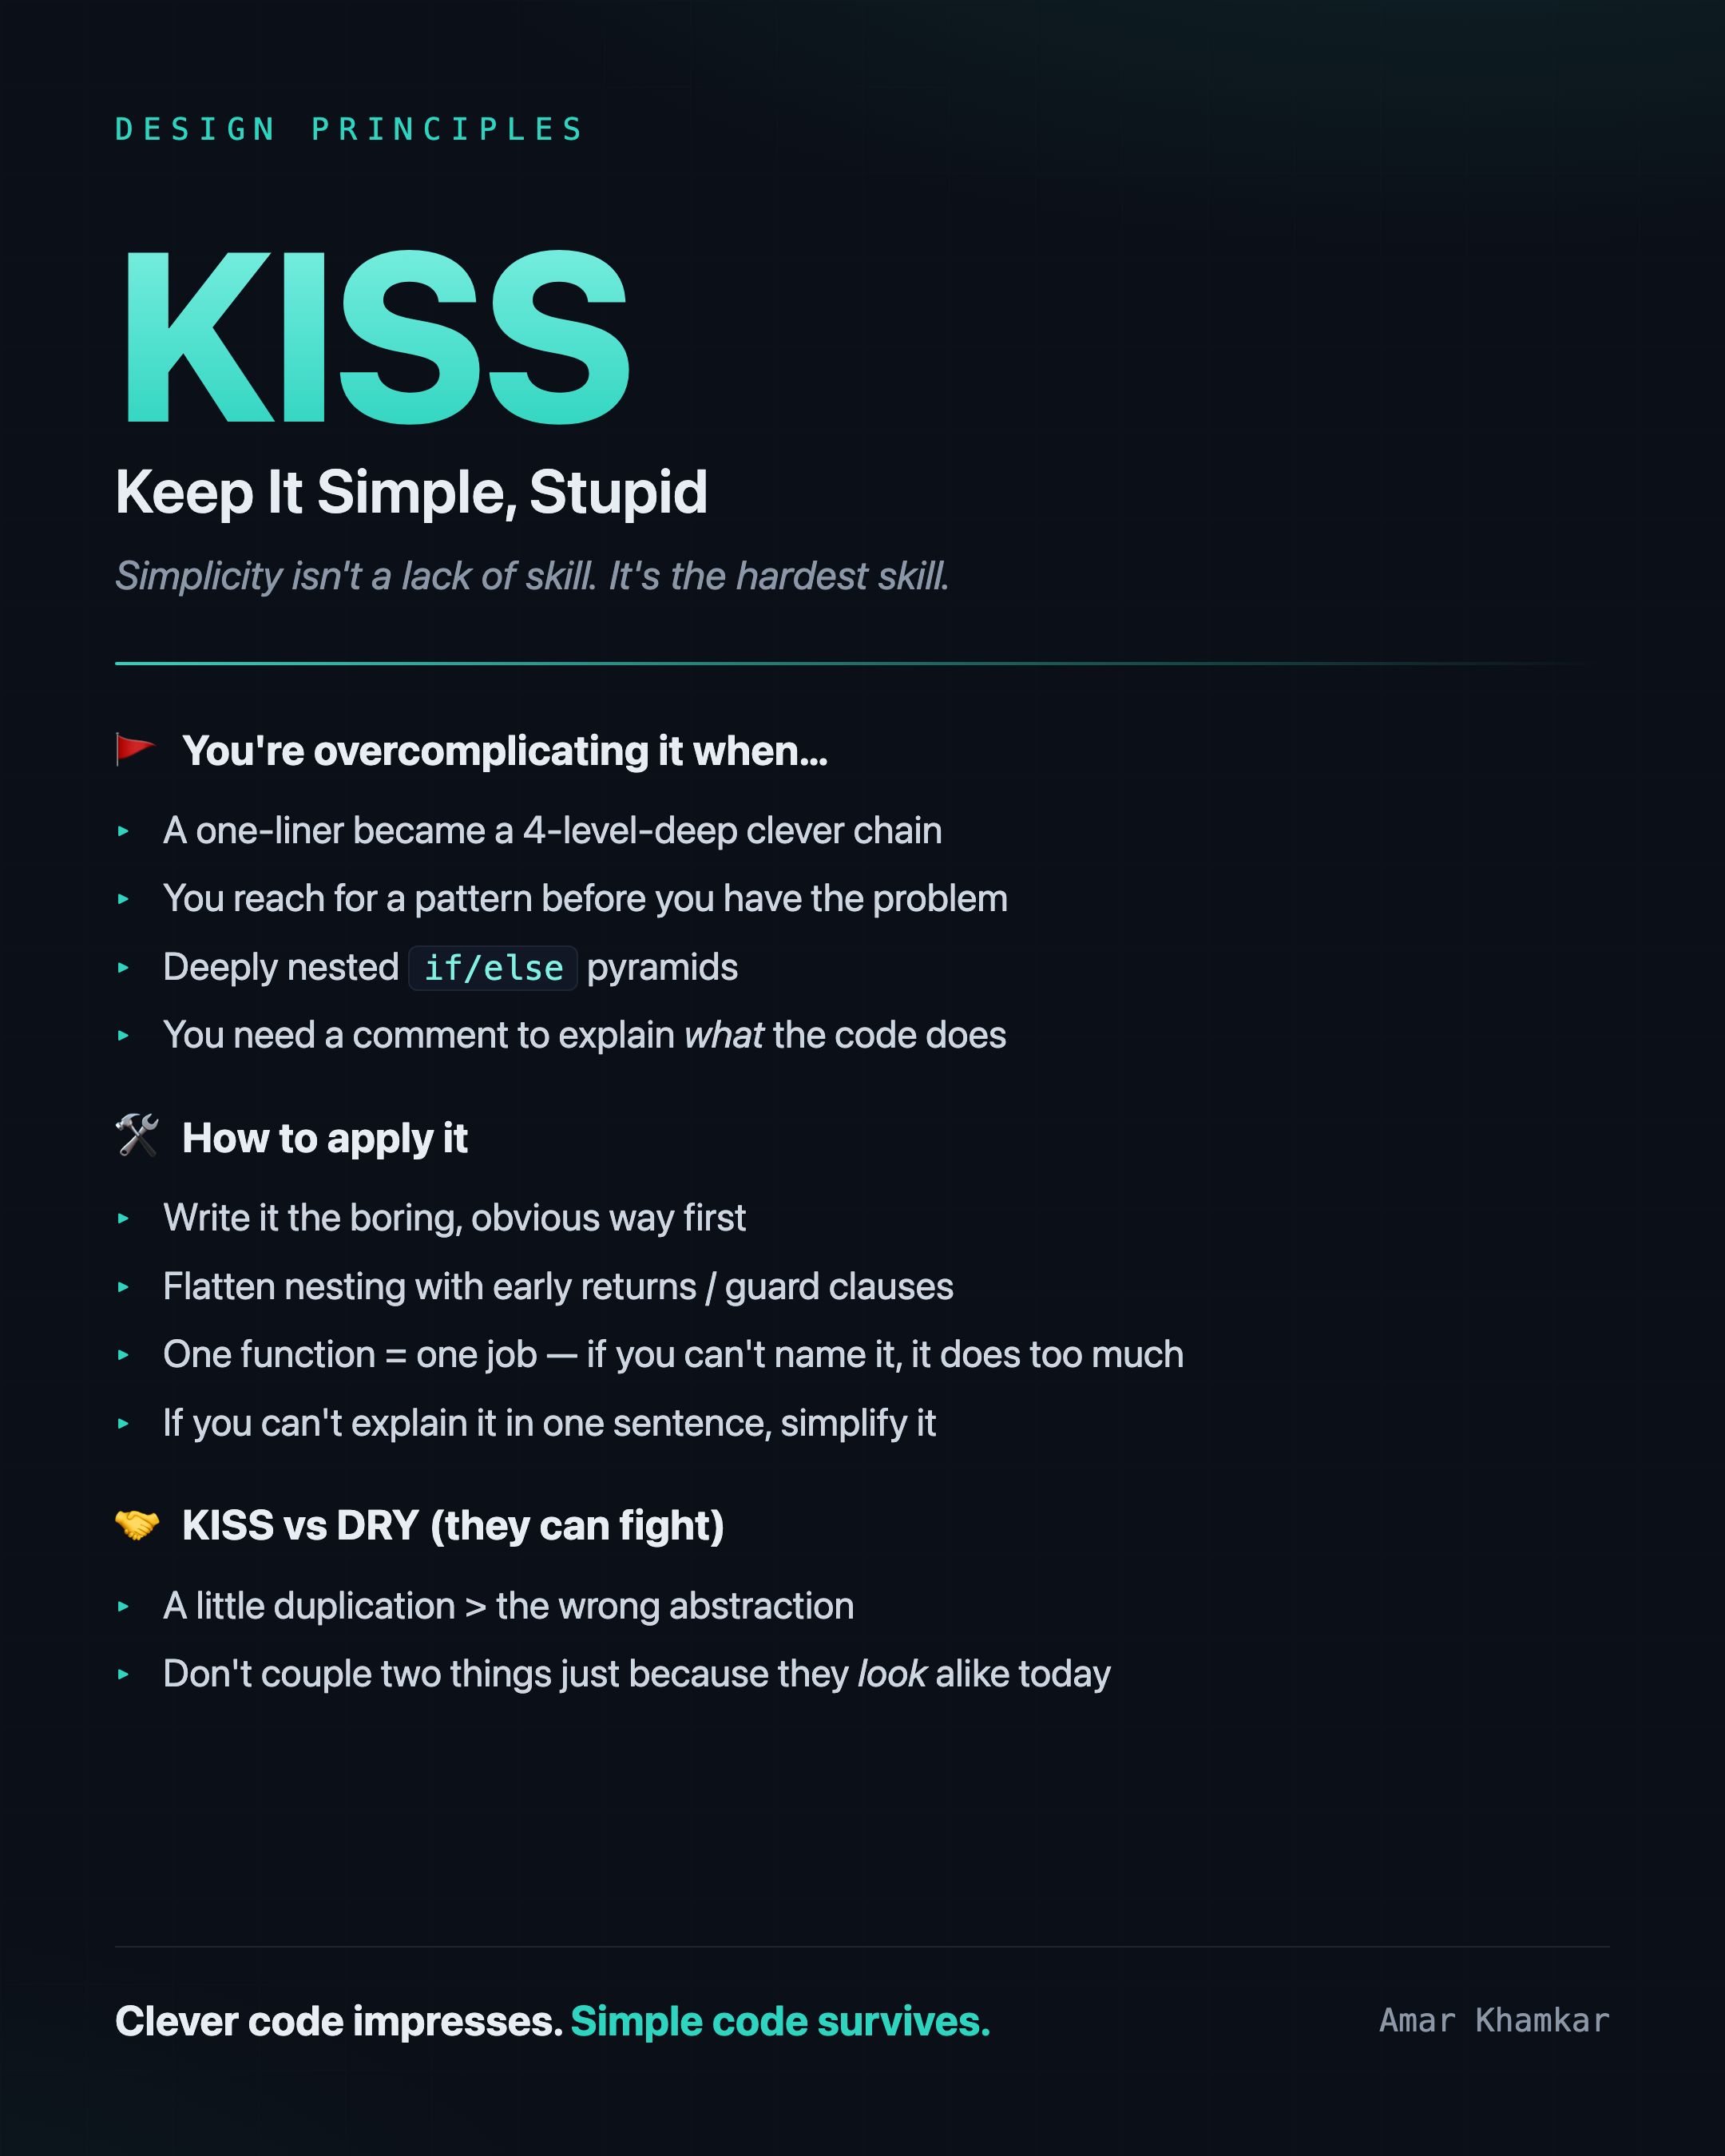
<hr />

<h2 id="kiss-keep-it-simple-stupid">KISS, Keep It Simple, Stupid</h2>

<blockquote>
  <p>Simplicity is not a lack of skill. It is actually the hardest skill.</p>
</blockquote>

<p>If YAGNI is about <em>how much</em> you build, KISS is about <em>how</em> you build it. It says, the simplest solution that fully solves the problem is the best one. Write for the next person who reads the code, and nine times out of ten that person is you, at 2am, during an incident.</p>

<h3 id="you-are-probably-overcomplicating-it-when">You are probably overcomplicating it when…</h3>

<ul>
  <li>A one-liner slowly grew into a four level deep “clever” chain that nobody can read.</li>
  <li>You reach for a design pattern <em>before</em> you actually have the problem that it solves.</li>
  <li>Your logic is a pyramid of deeply nested <code class="language-plaintext highlighter-rouge">if/else</code> blocks.</li>
  <li>You are reinventing something that the standard library already does.</li>
  <li>You need a comment to explain <em>what</em> the code does, not just <em>why</em> it does it.</li>
</ul>

<h3 id="how-to-apply-it-1">How to apply it</h3>

<ul>
  <li>Write it the <strong>boring, obvious way first.</strong> You can always make it clever later (and usually you will not need to).</li>
  <li>Flatten the nesting with <strong>early returns and guard clauses</strong>.</li>
  <li><strong>One function should do one job.</strong> If you cannot give it a clear name, it is doing too much.</li>
  <li>Prefer clear names over clever tricks.</li>
  <li>A simple test, <em>if you cannot explain it in one sentence, simplify it.</em></li>
</ul>

<h3 id="the-tension-with-dry">The tension with DRY</h3>

<p>KISS and DRY (Don’t Repeat Yourself) will sometimes fight each other, and when they do, KISS usually wins:</p>

<ul>
  <li><strong>A little bit of duplication is cheaper than the wrong abstraction.</strong></li>
  <li>Do not couple two pieces of code together just because they <em>look</em> similar today. Code that looks similar but changes for different reasons is not really duplication, it just rhymes.</li>
</ul>

<p><img src="/assets/img/design-principles/kiss.png" alt="KISS cheatsheet" />
<em>Clever code impresses in a PR. Simple code survives in production.</em></p>

<hr />

<h2 id="they-are-two-sides-of-the-same-coin">They are two sides of the same coin</h2>

<p>If you notice, both principles are really about the same thing, <strong>restraint</strong>.</p>

<ul>
  <li><strong>YAGNI</strong> stops you from building things that you do not need.</li>
  <li><strong>KISS</strong> stops you from over building the things that you <em>do</em> need.</li>
</ul>

<p>Together they push you towards the same place, the smallest and clearest amount of code that solves the actual problem. And restraint, it turns out, is the senior skill. Anyone can add more code. Knowing what <em>not</em> to add, and being confident enough to delete that speculative abstraction that someone (maybe you) was proud of, is what separates code that ages well from code that slowly becomes a maintenance tax.</p>

<blockquote>
  <p>As Einstein (supposedly) said, <em>“everything should be made as simple as possible, but not simpler.”</em></p>
</blockquote>

<p>So the next time you are about to add a flag, or an interface, or a clever one liner, just pause for a second and ask, <em>am I solving today’s problem, or a problem that I am only imagining?</em></p>

<p>The best code is the code that you did not have to write.</p>]]></content><author><name>Amar Khamkar</name></author><category term="ENGINEERING" /><category term="LEARNINGS" /><category term="design-principles" /><category term="yagni" /><category term="kiss" /><category term="clean-code" /><category term="best-practices" /><category term="backend" /><summary type="html"><![CDATA[Every senior engineer I respect ships less code than the juniors around them. Two principles explain why, YAGNI and KISS. Here is what they actually mean, when you are violating them, and how to apply them.]]></summary><media:thumbnail xmlns:media="http://search.yahoo.com/mrss/" url="https://blog.amarkhamkar.com/assets/img/design-principles/yagni.png" /><media:content medium="image" url="https://blog.amarkhamkar.com/assets/img/design-principles/yagni.png" xmlns:media="http://search.yahoo.com/mrss/" /></entry><entry><title type="html">From console.log to Kibana: How Your Pod’s Logs Actually Reach Elasticsearch</title><link href="https://blog.amarkhamkar.com/posts/HOW-LOGS-REACH-ELASTICSEARCH/" rel="alternate" type="text/html" title="From console.log to Kibana: How Your Pod’s Logs Actually Reach Elasticsearch" /><published>2026-07-17T18:30:00+00:00</published><updated>2026-07-17T18:30:00+00:00</updated><id>https://blog.amarkhamkar.com/posts/HOW-LOGS-REACH-ELASTICSEARCH</id><content type="html" xml:base="https://blog.amarkhamkar.com/posts/HOW-LOGS-REACH-ELASTICSEARCH/"><![CDATA[<p>Almost every backend engineer has heard of the <strong>ELK stack</strong>. Elasticsearch stores the logs, Kibana lets you search them, and <em>something</em> in the middle ships them there.</p>

<p>But there is one question that confused me for a long time. Your code runs inside a container, inside a pod, on some node in a cluster that you will probably never SSH into. So how does a single <code class="language-plaintext highlighter-rouge">console.log("payment failed")</code> actually reach Elasticsearch?</p>

<p>There is no magic here. It is a simple four hop pipeline:</p>

<div class="language-plaintext highlighter-rouge"><div class="highlight"><pre class="highlight"><code><table class="rouge-table"><tbody><tr><td class="rouge-gutter gl"><pre class="lineno">1
2
3
4
5
6
7
</pre></td><td class="rouge-code"><pre>Your app (stdout/stderr)
   ↓
Container runtime writes logs to a file on the node
   ↓
Fluentd (a DaemonSet running on every node) tails that file
   ↓
Fluentd ships the log to Elasticsearch  →  Kibana reads it
</pre></td></tr></tbody></table></code></pre></div></div>

<p>In my <a href="/posts/DEVOPS-ESSENTIALS/">DevOps Essentials post</a> I had promised that I will cover this DaemonSet based logging pattern in detail. So this is that post. Let’s walk through each hop slowly.</p>

<hr />

<h2 id="hop-1-your-app-only-writes-to-stdout-nothing-else">Hop 1: Your app only writes to stdout, nothing else</h2>

<p>The most important rule in container logging is also the one that feels the most odd in the beginning:</p>

<blockquote>
  <p>Your application should not manage log files. It should only write to <code class="language-plaintext highlighter-rouge">stdout</code> and <code class="language-plaintext highlighter-rouge">stderr</code>.</p>
</blockquote>

<p>No <code class="language-plaintext highlighter-rouge">app.log</code>. No log rotation logic. No shipping code inside your service. Just print.</p>

<div class="language-js highlighter-rouge"><div class="highlight"><pre class="highlight"><code><table class="rouge-table"><tbody><tr><td class="rouge-gutter gl"><pre class="lineno">1
2
3
</pre></td><td class="rouge-code"><pre><span class="c1">// This is all your app needs to do.</span>
<span class="nx">console</span><span class="p">.</span><span class="nf">log</span><span class="p">(</span><span class="nx">JSON</span><span class="p">.</span><span class="nf">stringify</span><span class="p">({</span> <span class="na">level</span><span class="p">:</span> <span class="dl">"</span><span class="s2">info</span><span class="dl">"</span><span class="p">,</span> <span class="na">msg</span><span class="p">:</span> <span class="dl">"</span><span class="s2">payment processed</span><span class="dl">"</span><span class="p">,</span> <span class="na">orderId</span><span class="p">:</span> <span class="mi">123</span> <span class="p">}));</span>
<span class="nx">console</span><span class="p">.</span><span class="nf">error</span><span class="p">(</span><span class="nx">JSON</span><span class="p">.</span><span class="nf">stringify</span><span class="p">({</span> <span class="na">level</span><span class="p">:</span> <span class="dl">"</span><span class="s2">error</span><span class="dl">"</span><span class="p">,</span> <span class="na">msg</span><span class="p">:</span> <span class="dl">"</span><span class="s2">gateway timeout</span><span class="dl">"</span><span class="p">,</span> <span class="na">orderId</span><span class="p">:</span> <span class="mi">456</span> <span class="p">}));</span>
</pre></td></tr></tbody></table></code></pre></div></div>

<p>This is one of the <strong>12-Factor App</strong> principles, treat your logs as event streams. Your app is just a producer that throws events out into the void. It does not know where they finally end up, and that is exactly the point. Routing, storing and searching the logs is somebody else’s job.</p>

<p>Why does this matter? Because it keeps your app separate from your logging setup. You can swap Elasticsearch for Loki, or Fluentd for Fluent Bit, and you do not have to touch a single line of your application code.</p>

<p>One small tip, log as structured JSON instead of plain strings. <code class="language-plaintext highlighter-rouge">{"level":"error","orderId":456}</code> is very easy to filter in Kibana. <code class="language-plaintext highlighter-rouge">"error processing order 456"</code> will only force you into fragile regex later.</p>

<hr />

<h2 id="hop-2-the-container-runtime-writes-stdout-into-a-file">Hop 2: The container runtime writes stdout into a file</h2>

<p>So your app printed something to stdout. Where does that stream go?</p>

<p>When a container writes to stdout/stderr, the <strong>container runtime</strong> (Docker, containerd, CRI-O) picks up those streams and writes them into a log file <strong>on the node’s filesystem</strong>. With Docker’s default <code class="language-plaintext highlighter-rouge">json-file</code> logging driver, every line becomes a JSON object like this:</p>

<div class="language-json highlighter-rouge"><div class="highlight"><pre class="highlight"><code><table class="rouge-table"><tbody><tr><td class="rouge-gutter gl"><pre class="lineno">1
</pre></td><td class="rouge-code"><pre><span class="p">{</span><span class="nl">"log"</span><span class="p">:</span><span class="s2">"{</span><span class="se">\"</span><span class="s2">level</span><span class="se">\"</span><span class="s2">:</span><span class="se">\"</span><span class="s2">error</span><span class="se">\"</span><span class="s2">,</span><span class="se">\"</span><span class="s2">msg</span><span class="se">\"</span><span class="s2">:</span><span class="se">\"</span><span class="s2">gateway timeout</span><span class="se">\"</span><span class="s2">}</span><span class="se">\n</span><span class="s2">"</span><span class="p">,</span><span class="nl">"stream"</span><span class="p">:</span><span class="s2">"stderr"</span><span class="p">,</span><span class="nl">"time"</span><span class="p">:</span><span class="s2">"2026-07-18T10:22:01.5Z"</span><span class="p">}</span><span class="w">
</span></pre></td></tr></tbody></table></code></pre></div></div>

<p>Notice how the runtime wraps <em>your</em> actual log line inside its own envelope. It adds which <code class="language-plaintext highlighter-rouge">stream</code> it came from (stdout or stderr) and a <code class="language-plaintext highlighter-rouge">time</code> stamp.</p>

<p>On a Kubernetes node these files live in some predictable places:</p>

<div class="language-plaintext highlighter-rouge"><div class="highlight"><pre class="highlight"><code><table class="rouge-table"><tbody><tr><td class="rouge-gutter gl"><pre class="lineno">1
2
</pre></td><td class="rouge-code"><pre>/var/log/pods/&lt;namespace&gt;_&lt;pod&gt;_&lt;uid&gt;/&lt;container&gt;/0.log
/var/log/containers/&lt;pod&gt;_&lt;namespace&gt;_&lt;container&gt;-&lt;id&gt;.log   # symlinks into the above
</pre></td></tr></tbody></table></code></pre></div></div>

<p>That <code class="language-plaintext highlighter-rouge">/var/log/containers/</code> directory is the important one. Every container on that node dumps its logs there, and the <strong>filename itself contains the pod, namespace and container name</strong>. Keep this point in mind, it becomes useful in the next hop.</p>

<p>This is also exactly what <code class="language-plaintext highlighter-rouge">kubectl logs &lt;pod&gt;</code> reads. That command is not doing anything fancy, it is just showing you the content of these node local files. And that is also why <code class="language-plaintext highlighter-rouge">kubectl logs</code> <strong>loses the history when a pod gets rescheduled or the node’s logs rotate</strong>. These node local files are temporary. That is the whole reason we need to ship them somewhere permanent.</p>

<hr />

<h2 id="hop-3-fluentd-one-collector-per-node-running-as-a-daemonset">Hop 3: Fluentd, one collector per node running as a DaemonSet</h2>

<p>Now the real question. Who reads all those <code class="language-plaintext highlighter-rouge">/var/log/containers/*.log</code> files and forwards them?</p>

<p>A log collector. The two names you will hear the most are <strong>Fluentd</strong> and its lighter cousin <strong>Fluent Bit</strong>. Their job is to <em>tail</em> the log files, parse them, enrich them and push them to some destination.</p>

<p>But here is the tricky part. How do you make sure the collector can see the logs of <strong>every</strong> container on <strong>every</strong> node? You cannot run it as a normal Deployment. A Deployment might place 3 replicas on a 10 node cluster, and then 7 nodes worth of logs will never get collected.</p>

<p>This is exactly the problem that a <strong>DaemonSet</strong> solves.</p>

<blockquote>
  <p>A <strong>DaemonSet</strong> makes sure that <strong>one copy of a pod runs on every node</strong> in the cluster. Add a new node and Kubernetes automatically schedules the collector on it. Remove a node and the collector goes away with it.</p>
</blockquote>

<p>That is exactly the guarantee that logging needs. One Fluentd pod per node, and each one is responsible only for the logs of the containers on <em>its own</em> node.</p>

<div class="language-plaintext highlighter-rouge"><div class="highlight"><pre class="highlight"><code><table class="rouge-table"><tbody><tr><td class="rouge-gutter gl"><pre class="lineno">1
2
3
4
5
6
7
8
9
10
11
12
13
14
15
</pre></td><td class="rouge-code"><pre>        Node A                    Node B                    Node C
 ┌──────────────────┐     ┌──────────────────┐     ┌──────────────────┐
 │  app pods...      │     │  app pods...      │     │  app pods...      │
 │  /var/log/        │     │  /var/log/        │     │  /var/log/        │
 │  containers/*.log │     │  containers/*.log │     │  containers/*.log │
 │        ▲          │     │        ▲          │     │        ▲          │
 │   ┌────┴─────┐    │     │   ┌────┴─────┐    │     │   ┌────┴─────┐    │
 │   │ fluentd  │    │     │   │ fluentd  │    │     │   │ fluentd  │    │
 │   │(DaemonSet│    │     │   │(DaemonSet│    │     │   │(DaemonSet│    │
 │   │   pod)   │    │     │   │   pod)   │    │     │   │   pod)   │    │
 │   └────┬─────┘    │     │   └────┬─────┘    │     │   └────┬─────┘    │
 └────────┼──────────┘     └────────┼──────────┘     └────────┼──────────┘
          └──────────────────────────┼──────────────────────────┘
                                      ▼
                              Elasticsearch
</pre></td></tr></tbody></table></code></pre></div></div>

<p>But how does a Fluentd pod read files that belong to the node and not to itself? Through a <strong>hostPath volume</strong>. The node’s <code class="language-plaintext highlighter-rouge">/var/log</code> directory is mounted straight into the Fluentd container:</p>

<div class="language-yaml highlighter-rouge"><div class="highlight"><pre class="highlight"><code><table class="rouge-table"><tbody><tr><td class="rouge-gutter gl"><pre class="lineno">1
2
3
4
5
6
7
8
9
10
11
12
13
14
15
16
17
18
19
20
21
22
23
24
25
26
27
28
</pre></td><td class="rouge-code"><pre><span class="na">apiVersion</span><span class="pi">:</span> <span class="s">apps/v1</span>
<span class="na">kind</span><span class="pi">:</span> <span class="s">DaemonSet</span>
<span class="na">metadata</span><span class="pi">:</span>
  <span class="na">name</span><span class="pi">:</span> <span class="s">fluentd</span>
  <span class="na">namespace</span><span class="pi">:</span> <span class="s">logging</span>
<span class="na">spec</span><span class="pi">:</span>
  <span class="na">selector</span><span class="pi">:</span>
    <span class="na">matchLabels</span><span class="pi">:</span> <span class="pi">{</span> <span class="nv">app</span><span class="pi">:</span> <span class="nv">fluentd</span> <span class="pi">}</span>
  <span class="na">template</span><span class="pi">:</span>
    <span class="na">metadata</span><span class="pi">:</span>
      <span class="na">labels</span><span class="pi">:</span> <span class="pi">{</span> <span class="nv">app</span><span class="pi">:</span> <span class="nv">fluentd</span> <span class="pi">}</span>
    <span class="na">spec</span><span class="pi">:</span>
      <span class="na">containers</span><span class="pi">:</span>
        <span class="pi">-</span> <span class="na">name</span><span class="pi">:</span> <span class="s">fluentd</span>
          <span class="na">image</span><span class="pi">:</span> <span class="s">fluent/fluentd-kubernetes-daemonset:v1-elasticsearch</span>
          <span class="na">env</span><span class="pi">:</span>
            <span class="pi">-</span> <span class="na">name</span><span class="pi">:</span> <span class="s">FLUENT_ELASTICSEARCH_HOST</span>
              <span class="na">value</span><span class="pi">:</span> <span class="s2">"</span><span class="s">elasticsearch.logging.svc.cluster.local"</span>
            <span class="pi">-</span> <span class="na">name</span><span class="pi">:</span> <span class="s">FLUENT_ELASTICSEARCH_PORT</span>
              <span class="na">value</span><span class="pi">:</span> <span class="s2">"</span><span class="s">9200"</span>
          <span class="na">volumeMounts</span><span class="pi">:</span>
            <span class="pi">-</span> <span class="na">name</span><span class="pi">:</span> <span class="s">varlog</span>
              <span class="na">mountPath</span><span class="pi">:</span> <span class="s">/var/log</span>            <span class="c1"># the node's log dir, read-only</span>
              <span class="na">readOnly</span><span class="pi">:</span> <span class="kc">true</span>
      <span class="na">volumes</span><span class="pi">:</span>
        <span class="pi">-</span> <span class="na">name</span><span class="pi">:</span> <span class="s">varlog</span>
          <span class="na">hostPath</span><span class="pi">:</span>
            <span class="na">path</span><span class="pi">:</span> <span class="s">/var/log</span>
</pre></td></tr></tbody></table></code></pre></div></div>

<p>Once it can see the files, Fluentd does three things:</p>

<ol>
  <li><strong>Tail</strong>, it follows every <code class="language-plaintext highlighter-rouge">/var/log/containers/*.log</code> file and picks up new lines as they get written (and it remembers its position, so that a restart does not resend everything again).</li>
  <li><strong>Enrich</strong>, remember the filename contains pod/namespace/container? Fluentd reads that and attaches Kubernetes metadata like <code class="language-plaintext highlighter-rouge">pod_name</code>, <code class="language-plaintext highlighter-rouge">namespace</code>, <code class="language-plaintext highlighter-rouge">labels</code>, <code class="language-plaintext highlighter-rouge">node_name</code>. So in Kibana you can filter by <code class="language-plaintext highlighter-rouge">namespace: payments</code> or <code class="language-plaintext highlighter-rouge">pod: checkout-7f9c</code>.</li>
  <li><strong>Buffer and forward</strong>, it batches the records into a buffer and ships them ahead. If Elasticsearch is slow or down, the buffer holds the logs and retries instead of dropping them.</li>
</ol>

<p>A trimmed down Fluentd config for this flow looks like this:</p>

<div class="language-plaintext highlighter-rouge"><div class="highlight"><pre class="highlight"><code><table class="rouge-table"><tbody><tr><td class="rouge-gutter gl"><pre class="lineno">1
2
3
4
5
6
7
8
9
10
11
12
13
14
15
16
17
18
19
20
21
22
23
24
25
26
27
</pre></td><td class="rouge-code"><pre># 1. TAIL — read every container log file on this node
&lt;source&gt;
  @type tail
  path /var/log/containers/*.log
  pos_file /var/log/fluentd-containers.log.pos
  tag kube.*
  &lt;parse&gt;
    @type json
  &lt;/parse&gt;
&lt;/source&gt;

# 2. ENRICH — add pod/namespace/labels from the K8s API
&lt;filter kube.**&gt;
  @type kubernetes_metadata
&lt;/filter&gt;

# 3. FORWARD — batch and ship to Elasticsearch, buffering on failure
&lt;match kube.**&gt;
  @type elasticsearch
  host elasticsearch.logging.svc.cluster.local
  port 9200
  logstash_format true          # daily indices: logstash-2026.07.18
  &lt;buffer&gt;
    flush_interval 5s
    retry_max_times 10
  &lt;/buffer&gt;
&lt;/match&gt;
</pre></td></tr></tbody></table></code></pre></div></div>

<hr />

<h2 id="hop-4-elasticsearch-stores-it-and-kibana-shows-it">Hop 4: Elasticsearch stores it and Kibana shows it</h2>

<p>Fluentd pushes every enriched record to Elasticsearch over HTTP. Elasticsearch indexes it, usually into a <strong>daily index</strong> like <code class="language-plaintext highlighter-rouge">logstash-2026.07.18</code> (that is what the <code class="language-plaintext highlighter-rouge">logstash_format true</code> line above does). Daily indices make retention very easy, to delete last month’s logs you just drop those indices.</p>

<p>Then <strong>Kibana</strong> connects to Elasticsearch and gives you the search UI. So now that <code class="language-plaintext highlighter-rouge">console.log("payment failed")</code> from Hop 1 is:</p>

<ul>
  <li>searchable by full text (<code class="language-plaintext highlighter-rouge">msg: "payment failed"</code>)</li>
  <li>filterable by the metadata that Fluentd added (<code class="language-plaintext highlighter-rouge">namespace: payments AND level: error</code>)</li>
  <li>and you can correlate it across every pod and node in the cluster, all in one place</li>
</ul>

<p>The full journey, end to end:</p>

<div class="language-plaintext highlighter-rouge"><div class="highlight"><pre class="highlight"><code><table class="rouge-table"><tbody><tr><td class="rouge-gutter gl"><pre class="lineno">1
2
3
4
5
6
7
8
9
</pre></td><td class="rouge-code"><pre>console.log(...)                        ← your code, Hop 1
   ↓ stdout
/var/log/containers/checkout-*.log      ← container runtime, Hop 2
   ↓ tailed by
fluentd DaemonSet pod on that node      ← Hop 3
   ↓ enrich + buffer + HTTP POST
Elasticsearch  (index: logstash-2026.07.18)
   ↓
Kibana  ← you, searching at 2am during an incident
</pre></td></tr></tbody></table></code></pre></div></div>

<hr />

<h2 id="the-l-in-elk-is-not-always-logstash">The “L” in ELK is not always Logstash</h2>

<p>One naming confusion that is worth clearing up. ELK stands for <strong>E</strong>lasticsearch, <strong>L</strong>ogstash, <strong>K</strong>ibana. But in Kubernetes you will rarely see Logstash sitting on the nodes. Logstash is heavy (it runs on the JVM) and it was built as a central processing pipeline, not as a per node agent.</p>

<p>So the modern per node collector is almost always <strong>Fluentd</strong> or <strong>Fluent Bit</strong>:</p>

<table>
  <thead>
    <tr>
      <th> </th>
      <th>Fluentd</th>
      <th>Fluent Bit</th>
    </tr>
  </thead>
  <tbody>
    <tr>
      <td>Written in</td>
      <td>Ruby (+ C core)</td>
      <td>Pure C</td>
    </tr>
    <tr>
      <td>Memory footprint</td>
      <td>~40 MB+</td>
      <td>~1 MB</td>
    </tr>
    <tr>
      <td>Plugins</td>
      <td>Huge ecosystem</td>
      <td>Smaller, growing</td>
    </tr>
    <tr>
      <td>Typical role</td>
      <td>Aggregator / node agent</td>
      <td>Lightweight node agent</td>
    </tr>
  </tbody>
</table>

<p>A very common production setup is to run <strong>Fluent Bit as the tiny per node DaemonSet</strong> and have it forward to a <strong>central Fluentd aggregator</strong> that does the heavy parsing before Elasticsearch. Same pipeline shape, just split into two tiers. (When people say “EFK stack”, that <strong>F</strong> is exactly this Fluentd/Fluent Bit swap.)</p>

<hr />

<h2 id="some-gotchas-i-have-hit-so-you-dont-have-to">Some gotchas I have hit (so you don’t have to)</h2>

<ul>
  <li><strong>Do not write logs to a file inside the container.</strong> If your app writes to <code class="language-plaintext highlighter-rouge">/app/logs/app.log</code>, the collector (which only watches stdout) will never see it, and that file dies with the pod. Just print to stdout.</li>
  <li><strong>Multiline stack traces get split.</strong> Each line of a Java or Node stack trace is a separate stdout write, so the collector treats each line as a separate log record. You need a multiline parser to stitch them back into one event.</li>
  <li><strong>Log rotation is real.</strong> The kubelet rotates the container log files (default around 10 MB). A good collector follows the rotation using its position file, a naive one can double send or miss lines around the rotation boundary.</li>
  <li><strong>Backpressure will bite you.</strong> If Elasticsearch cannot keep up, the collector’s buffer fills up. Size your buffers and set retry limits, otherwise a slow Elasticsearch can OOM your logging pods or silently drop logs.</li>
  <li><strong><code class="language-plaintext highlighter-rouge">kubectl logs</code> is not your log store.</strong> It reads node local files that vanish on reschedule. It is good for a quick debug, but never for history or auditing. That is Elasticsearch’s job.</li>
</ul>

<hr />

<h2 id="wrapping-up">Wrapping up</h2>

<p>The ELK stack feels like a black box until you trace the one path that actually matters:</p>

<p><strong>Your app prints to stdout, the container runtime writes it to a file on the node, a Fluentd DaemonSet (one per node) tails that file, enriches it with pod metadata and ships it, Elasticsearch stores it, and Kibana lets you search it.</strong></p>

<p>The nice part here is the separation of concerns. Your application does the simplest possible thing, it just prints. The DaemonSet makes sure there is a collector on every node with zero per app wiring. And swapping any piece of this pipeline never touches your code.</p>

<p>That is the whole trick really. No magic, just stdout, a file, and a collector that runs everywhere.</p>]]></content><author><name>Amar Khamkar</name></author><category term="DEVOPS" /><category term="LEARNINGS" /><category term="devops" /><category term="kubernetes" /><category term="logging" /><category term="elasticsearch" /><category term="fluentd" /><category term="daemonset" /><category term="observability" /><category term="backend" /><summary type="html"><![CDATA[We all know the ELK stack. But how does a log line printed inside a Kubernetes pod actually travel all the way to Elasticsearch? Here is the full journey, from stdout to docker logs to fluentd to Elasticsearch.]]></summary></entry><entry><title type="html">The 8-Second Query That Was Actually Five Doomed Retries</title><link href="https://blog.amarkhamkar.com/posts/RETRY-STORM-RACE-CONDITION/" rel="alternate" type="text/html" title="The 8-Second Query That Was Actually Five Doomed Retries" /><published>2026-07-13T18:30:00+00:00</published><updated>2026-07-13T18:30:00+00:00</updated><id>https://blog.amarkhamkar.com/posts/RETRY-STORM-RACE-CONDITION</id><content type="html" xml:base="https://blog.amarkhamkar.com/posts/RETRY-STORM-RACE-CONDITION/"><![CDATA[<p>A dashboard panel caught my eye one day. The p95 response time for one endpoint was spiking to around <strong>8 seconds</strong>, a few times a day. Everything else on that same endpoint was sitting comfortably under 100ms.</p>

<p>The strange part is that every one of these slow requests returned a normal <strong>HTTP 200</strong>. Nothing was actually failing. It was just slow, once in a while, and nobody could explain why.</p>

<p>This post is the story of chasing that 8 seconds all the way down to its root, and the surprisingly small fix at the end.</p>

<hr />

<h2 id="clue-1-the-spikes-were-suspiciously-identical">Clue #1: The spikes were suspiciously identical</h2>

<p>The first thing I did was pull the raw durations of the slow requests, instead of trusting the aggregated p95. This is roughly what I saw:</p>

<div class="language-plaintext highlighter-rouge"><div class="highlight"><pre class="highlight"><code><table class="rouge-table"><tbody><tr><td class="rouge-gutter gl"><pre class="lineno">1
2
3
4
5
6
7
8
</pre></td><td class="rouge-code"><pre>8419ms
8299ms
8261ms
8260ms
8258ms
8249ms
8249ms
...
</pre></td></tr></tbody></table></code></pre></div></div>

<p>Look at how tightly these numbers are clustered. All of them are within around 200ms of <strong>8.2 seconds</strong>.</p>

<p>That is a big hint. Real load is noisy. If the slowness was coming from a busy database, or a slow network hop, or CPU contention, you would see a spread like 2s, 5s, 11s, 800ms. When the latency clusters this tightly around a single constant, it is usually not load. It is a <strong>fixed delay</strong> sitting somewhere in the code path, like a timeout, a sleep, or a retry schedule.</p>

<p>So the question changed from <em>“why is the database slow?”</em> to <em>“what in my code takes exactly 8.2 seconds?”</em></p>

<hr />

<h2 id="clue-2-the-time-was-not-where-i-expected">Clue #2: The time was not where I expected</h2>

<p>I took one slow request and pulled every log line for it in order, with per statement timing. The actual job of the endpoint, its main query and the response, took only about <strong>30 milliseconds</strong>. The rest of the 8.2 seconds was spent <em>before</em> that, inside what looked like a routine “find or create this record” step in an authentication middleware.</p>

<p>Here is the trace, cleaned up a bit:</p>

<div class="language-plaintext highlighter-rouge"><div class="highlight"><pre class="highlight"><code><table class="rouge-table"><tbody><tr><td class="rouge-gutter gl"><pre class="lineno">1
2
3
4
5
6
7
8
9
10
</pre></td><td class="rouge-code"><pre>12.839  START TRANSACTION
12.841  SELECT ... WHERE unique_col = X   -&gt; no row found
12.855  INSERT ...                         (14ms)
14.044  INSERT ...                         (6ms)   &lt;- ~1.19s later
15.545  INSERT ...                         (1ms)   &lt;- ~1.50s later
17.797  INSERT ...                         (1ms)   &lt;- ~2.25s later
21.175  INSERT ...                         (1ms)   &lt;- ~3.38s later
21.177  SELECT ... WHERE unique_col = X   -&gt; found it
21.178  COMMIT
21.215  Done — 8419ms
</pre></td></tr></tbody></table></code></pre></div></div>

<p>Two things jumped out at me:</p>

<ol>
  <li>There are <strong>five INSERT statements</strong> for what should have been a single insert.</li>
  <li><strong>Each INSERT itself finishes in 1 to 14ms.</strong> Nothing is blocked waiting on a lock. All the time is in the <em>gaps between</em> the inserts, and those gaps keep growing: around 1.2s, then 1.5s, then 2.25s, then 3.4s.</li>
</ol>

<p>Growing gaps between the same operation is a classic sign of <strong>exponential backoff</strong>. Something was retrying that INSERT five times, sleeping a little longer each time, before finally giving up and reading the row instead.</p>

<hr />

<h2 id="the-code-an-innocent-looking-findorcreate">The code: an innocent looking <code class="language-plaintext highlighter-rouge">findOrCreate</code></h2>

<p>The middleware creates a local record for a user the first time it sees them. In Sequelize (a popular Node.js ORM), that is a one liner:</p>

<div class="language-javascript highlighter-rouge"><div class="highlight"><pre class="highlight"><code><table class="rouge-table"><tbody><tr><td class="rouge-gutter gl"><pre class="lineno">1
2
3
4
</pre></td><td class="rouge-code"><pre><span class="kd">const</span> <span class="p">[</span><span class="nx">user</span><span class="p">]</span> <span class="o">=</span> <span class="k">await</span> <span class="nx">User</span><span class="p">.</span><span class="nf">findOrCreate</span><span class="p">({</span>
  <span class="na">where</span><span class="p">:</span> <span class="p">{</span> <span class="na">external_id</span><span class="p">:</span> <span class="nx">id</span> <span class="p">},</span>
  <span class="na">defaults</span><span class="p">:</span> <span class="p">{</span> <span class="nx">name</span><span class="p">,</span> <span class="nx">email</span><span class="p">,</span> <span class="na">external_id</span><span class="p">:</span> <span class="nx">id</span> <span class="p">},</span>
<span class="p">});</span>
</pre></td></tr></tbody></table></code></pre></div></div>

<p><code class="language-plaintext highlighter-rouge">findOrCreate</code> does exactly what the name says. It runs a <code class="language-plaintext highlighter-rouge">SELECT</code> using the <code class="language-plaintext highlighter-rouge">where</code> clause, and if nothing is found, it does an <code class="language-plaintext highlighter-rouge">INSERT</code> with the <code class="language-plaintext highlighter-rouge">defaults</code>. Simple enough. So why five inserts?</p>

<hr />

<h2 id="the-root-cause-a-race-and-a-retry-policy-that-could-not-tell-the-difference">The root cause: a race, and a retry policy that could not tell the difference</h2>

<p>Here is what was actually happening.</p>

<p>When a brand new user arrives for the first time, the client fires <strong>several requests at once</strong> (a typical bootstrap, fetch status, fetch a token, fetch some config), and all of them carry the same new user id. Each of these requests independently reaches that <code class="language-plaintext highlighter-rouge">findOrCreate</code>.</p>

<p>And now the classic race plays out:</p>

<ol>
  <li>Two requests run the <code class="language-plaintext highlighter-rouge">SELECT</code> at almost the same time. <strong>Both of them see no row.</strong></li>
  <li>Both go ahead and <code class="language-plaintext highlighter-rouge">INSERT</code>.</li>
  <li>One transaction commits first and <strong>wins</strong>, so the row now exists.</li>
  <li>The other request’s <code class="language-plaintext highlighter-rouge">INSERT</code> violates the <strong>unique constraint</strong> on the column, and the database rejects it with a duplicate key error (<code class="language-plaintext highlighter-rouge">ER_DUP_ENTRY</code> in MySQL, which Sequelize surfaces as a <code class="language-plaintext highlighter-rouge">UniqueConstraintError</code>).</li>
</ol>

<p>This race is completely normal and expected. It is <em>why</em> the unique constraint is there in the first place. And <code class="language-plaintext highlighter-rouge">findOrCreate</code> already handles it correctly. On a unique constraint error it catches the exception and does a second <code class="language-plaintext highlighter-rouge">SELECT</code> to return the row that the winner just created.</p>

<p><strong>But there was a retry policy sitting underneath all of this.</strong> Sequelize lets you configure automatic query retries (through the <code class="language-plaintext highlighter-rouge">retry</code> option, powered by <code class="language-plaintext highlighter-rouge">retry-as-promised</code>), usually added to survive <em>transient</em> failures like deadlocks or dropped connections. Sequelize even ships a sensible, conservative default, retry on exactly one known transient error:</p>

<div class="language-javascript highlighter-rouge"><div class="highlight"><pre class="highlight"><code><table class="rouge-table"><tbody><tr><td class="rouge-gutter gl"><pre class="lineno">1
2
</pre></td><td class="rouge-code"><pre><span class="c1">// Sequelize's built-in default</span>
<span class="nx">retry</span><span class="p">:</span> <span class="p">{</span> <span class="nl">max</span><span class="p">:</span> <span class="mi">5</span><span class="p">,</span> <span class="nx">match</span><span class="p">:</span> <span class="p">[</span><span class="dl">"</span><span class="s2">SQLITE_BUSY: database is locked</span><span class="dl">"</span><span class="p">]</span> <span class="p">}</span>
</pre></td></tr></tbody></table></code></pre></div></div>

<p>So how did a duplicate key error, which is not in that list, end up getting retried? This is the part that surprised me, and it comes down to two behaviours combining together.</p>

<p><strong>First</strong>, the config had overridden <code class="language-plaintext highlighter-rouge">retry</code> to tune the backoff, but without specifying <code class="language-plaintext highlighter-rouge">match</code>:</p>

<div class="language-javascript highlighter-rouge"><div class="highlight"><pre class="highlight"><code><table class="rouge-table"><tbody><tr><td class="rouge-gutter gl"><pre class="lineno">1
2
3
4
5
6
7
</pre></td><td class="rouge-code"><pre><span class="c1">// somewhere in the DB config</span>
<span class="nx">retry</span><span class="p">:</span> <span class="p">{</span>
  <span class="nl">max</span><span class="p">:</span> <span class="mi">5</span><span class="p">,</span>
  <span class="nx">backoffBase</span><span class="p">:</span> <span class="mi">1000</span><span class="p">,</span>
  <span class="nx">backoffExponent</span><span class="p">:</span> <span class="mf">1.5</span><span class="p">,</span>
  <span class="c1">// note: no `match` key</span>
<span class="p">}</span>
</pre></td></tr></tbody></table></code></pre></div></div>

<p>Sequelize merges these options with a <strong>shallow spread</strong>, so this custom block does not <em>extend</em> the default, it <em>replaces</em> it completely. The curated <code class="language-plaintext highlighter-rouge">match: ["SQLITE_BUSY"]</code> is silently gone. You can actually watch it happen:</p>

<div class="language-javascript highlighter-rouge"><div class="highlight"><pre class="highlight"><code><table class="rouge-table"><tbody><tr><td class="rouge-gutter gl"><pre class="lineno">1
2
3
4
5
</pre></td><td class="rouge-code"><pre><span class="k">new</span> <span class="nc">Sequelize</span><span class="p">(</span><span class="nx">db</span><span class="p">,</span> <span class="p">{</span> <span class="na">dialect</span><span class="p">:</span> <span class="dl">"</span><span class="s2">mysql</span><span class="dl">"</span> <span class="p">}).</span><span class="nx">options</span><span class="p">.</span><span class="nx">retry</span><span class="p">;</span>
<span class="c1">//=&gt; { max: 5, match: ["SQLITE_BUSY: database is locked"] }</span>

<span class="k">new</span> <span class="nc">Sequelize</span><span class="p">(</span><span class="nx">db</span><span class="p">,</span> <span class="p">{</span> <span class="na">dialect</span><span class="p">:</span> <span class="dl">"</span><span class="s2">mysql</span><span class="dl">"</span><span class="p">,</span> <span class="na">retry</span><span class="p">:</span> <span class="p">{</span> <span class="na">max</span><span class="p">:</span> <span class="mi">5</span><span class="p">,</span> <span class="na">backoffBase</span><span class="p">:</span> <span class="mi">1000</span> <span class="p">}</span> <span class="p">}).</span><span class="nx">options</span><span class="p">.</span><span class="nx">retry</span><span class="p">;</span>
<span class="c1">//=&gt; { max: 5, backoffBase: 1000 }   // &lt;-- no `match` anymore</span>
</pre></td></tr></tbody></table></code></pre></div></div>

<p><strong>Second</strong>, and this is the real trap, an <em>empty or missing</em> <code class="language-plaintext highlighter-rouge">match</code> does not mean “retry nothing”. In <code class="language-plaintext highlighter-rouge">retry-as-promised</code> it means the exact opposite:</p>

<div class="language-javascript highlighter-rouge"><div class="highlight"><pre class="highlight"><code><table class="rouge-table"><tbody><tr><td class="rouge-gutter gl"><pre class="lineno">1
2
</pre></td><td class="rouge-code"><pre><span class="c1">// retry-as-promised</span>
<span class="nx">shouldRetry</span> <span class="o">=</span> <span class="nx">options</span><span class="p">.</span><span class="nx">match</span><span class="p">.</span><span class="nx">length</span> <span class="o">===</span> <span class="mi">0</span> <span class="o">||</span> <span class="nx">options</span><span class="p">.</span><span class="nx">match</span><span class="p">.</span><span class="nf">some</span><span class="p">(</span><span class="nx">m</span> <span class="o">=&gt;</span> <span class="nf">matches</span><span class="p">(</span><span class="nx">m</span><span class="p">,</span> <span class="nx">err</span><span class="p">));</span>
</pre></td></tr></tbody></table></code></pre></div></div>

<p><code class="language-plaintext highlighter-rouge">match.length === 0</code> short circuits to <code class="language-plaintext highlighter-rouge">true</code>. So <strong>no filter actually means retry on <em>every</em> error.</strong> Leaving <code class="language-plaintext highlighter-rouge">match</code> off is the most aggressive setting, not the safest one.</p>

<p>Put it all together. The backoff override wiped out the default allowlist, the now empty <code class="language-plaintext highlighter-rouge">match</code> meant “retry everything”, and so the losing INSERT’s duplicate key error was treated as retryable. The retry layer re-ran the <strong>identical</strong> INSERT, with backoff, five times, even though nobody ever listed that error as retryable.</p>

<p>And here is the thing that makes this a real bug and not just slowness. <strong>A duplicate key error is permanent.</strong> The winning row is already committed. Re-running the exact same INSERT will fail in exactly the same way, every single time, forever. There is no version of “try again” that can ever succeed. So the retry policy was spending 8 seconds sleeping between attempts that were guaranteed to fail, and only <em>after</em> exhausting all five did the error finally reach <code class="language-plaintext highlighter-rouge">findOrCreate</code>’s catch block, which then did the one thing that actually works, read the row.</p>

<p>The delays match the config almost exactly:</p>

<table>
  <thead>
    <tr>
      <th style="text-align: right">Retry</th>
      <th><code class="language-plaintext highlighter-rouge">backoffBase * backoffExponent^(n-1)</code></th>
      <th style="text-align: right">Delay</th>
    </tr>
  </thead>
  <tbody>
    <tr>
      <td style="text-align: right">1</td>
      <td>1000 × 1.5⁰</td>
      <td style="text-align: right">1000ms</td>
    </tr>
    <tr>
      <td style="text-align: right">2</td>
      <td>1000 × 1.5¹</td>
      <td style="text-align: right">1500ms</td>
    </tr>
    <tr>
      <td style="text-align: right">3</td>
      <td>1000 × 1.5²</td>
      <td style="text-align: right">2250ms</td>
    </tr>
    <tr>
      <td style="text-align: right">4</td>
      <td>1000 × 1.5³</td>
      <td style="text-align: right">3375ms</td>
    </tr>
    <tr>
      <td style="text-align: right"> </td>
      <td><strong>total</strong></td>
      <td style="text-align: right"><strong>~8.1s</strong></td>
    </tr>
  </tbody>
</table>

<p>And there is the 8.2 seconds.</p>

<hr />

<h2 id="an-overlooked-side-effect-connection-starvation">An overlooked side effect: connection starvation</h2>

<p>The latency was the visible symptom, but there is a nastier problem hiding underneath it.</p>

<p>That whole 8.2s happens <em>inside an open transaction</em>, which holds a connection checked out from the pool the entire time. Connection pools are small (5, 10, maybe 20 per instance). If a burst of new users arrives together, several connections can each get pinned for 8 seconds doing nothing except sleeping between doomed retries. Once the pool is exhausted, even <strong>unrelated</strong> requests start queuing for a connection. So one user’s harmless race can quietly degrade the latency for everyone on that instance.</p>

<p>Non-blocking I/O saves the event loop here (the backoff is a <code class="language-plaintext highlighter-rouge">setTimeout</code>, not a busy wait, so the CPU stays free), but the connection is still held the whole time. “It’s async so it’s fine” does not cover the resources you are holding across the await.</p>

<hr />

<h2 id="the-fix">The fix</h2>

<p>The correct recovery for a <code class="language-plaintext highlighter-rouge">findOrCreate</code> race is not “retry the insert”, it is “read the row that someone else just created”. That logic already exists in <code class="language-plaintext highlighter-rouge">findOrCreate</code>’s catch block. All I had to do was stop the retry layer from getting in its way:</p>

<div class="language-javascript highlighter-rouge"><div class="highlight"><pre class="highlight"><code><table class="rouge-table"><tbody><tr><td class="rouge-gutter gl"><pre class="lineno">1
2
3
4
5
6
7
8
</pre></td><td class="rouge-code"><pre><span class="kd">const</span> <span class="p">[</span><span class="nx">user</span><span class="p">]</span> <span class="o">=</span> <span class="k">await</span> <span class="nx">User</span><span class="p">.</span><span class="nf">findOrCreate</span><span class="p">({</span>
  <span class="na">where</span><span class="p">:</span> <span class="p">{</span> <span class="na">external_id</span><span class="p">:</span> <span class="nx">id</span> <span class="p">},</span>
  <span class="na">defaults</span><span class="p">:</span> <span class="p">{</span> <span class="nx">name</span><span class="p">,</span> <span class="nx">email</span><span class="p">,</span> <span class="na">external_id</span><span class="p">:</span> <span class="nx">id</span> <span class="p">},</span>
  <span class="c1">// A duplicate-key error here is the *expected* outcome of a race, not a</span>
  <span class="c1">// transient fault. Don't retry it — fall straight through to the built-in</span>
  <span class="c1">// findOne fallback instead of burning the backoff budget on a doomed INSERT.</span>
  <span class="na">retry</span><span class="p">:</span> <span class="p">{</span> <span class="na">max</span><span class="p">:</span> <span class="mi">0</span> <span class="p">},</span>
<span class="p">});</span>
</pre></td></tr></tbody></table></code></pre></div></div>

<p>I verified this with a tiny standalone script using the same libraries. I stubbed a <code class="language-plaintext highlighter-rouge">create</code> that always throws a <code class="language-plaintext highlighter-rouge">UniqueConstraintError</code>, and then timed it under the old policy versus the fix:</p>

<div class="language-plaintext highlighter-rouge"><div class="highlight"><pre class="highlight"><code><table class="rouge-table"><tbody><tr><td class="rouge-gutter gl"><pre class="lineno">1
2
</pre></td><td class="rouge-code"><pre>BEFORE (retry max:5)   attempts=5   elapsed=8130.6ms
AFTER  (retry max:0)   attempts=1   elapsed=0.1ms
</pre></td></tr></tbody></table></code></pre></div></div>

<p>So it went from <strong>around 8,130ms to around 0.1ms</strong> per losing request. Same outcome (the error still propagates to the read fallback), just without all the pointless sleeping.</p>

<h3 id="should-you-keep-one-retry">Should you keep <em>one</em> retry?</h3>

<p>Tempting, but no. A single retry (<code class="language-plaintext highlighter-rouge">max: 1</code>) still costs a full ~1s backoff sleep and still fails, because the duplicate is permanent. One retry of a non retryable error is pure waste. The real value of retries lives entirely with <em>transient</em> errors, which brings me to the deeper fix.</p>

<h3 id="the-deeper-fix">The deeper fix</h3>

<p>Disabling retry at this one call site is the fast, local patch. The real root cause is broader. The retry policy had no <code class="language-plaintext highlighter-rouge">match</code> allowlist at all, so it was retrying <em>every</em> error. The proper fix is to give it an <strong>explicit</strong> <code class="language-plaintext highlighter-rouge">match</code> that lists only genuinely retryable failures, like deadlocks, lock wait timeouts and connection resets, and never deterministic ones like unique constraint violations. That fixes every <code class="language-plaintext highlighter-rouge">findOrCreate</code> and <code class="language-plaintext highlighter-rouge">create</code> in the codebase at once, not just the one I happened to be looking at. (I also reported the silent default wiping behaviour upstream, since “override the backoff, accidentally retry everything” is a sharp edge worth flagging.)</p>

<hr />

<h2 id="some-lessons-worth-keeping">Some lessons worth keeping</h2>

<ol>
  <li>
    <p><strong>Tightly clustered latency is a fixed delay, not load.</strong> If your slow requests all land within a few percent of the same number, stop staring at load graphs and start looking for a timeout, a sleep, or a retry schedule in the code.</p>
  </li>
  <li>
    <p><strong>Measure <em>where</em> the time goes before theorising about <em>why</em>.</strong> Per statement timing turned “the database is slow” into “we sleep for 8 seconds between five inserts” in about two minutes. Once you can say the second sentence, the fix is almost obvious.</p>
  </li>
  <li>
    <p><strong>Not every error is retryable, and check what “no filter” actually means.</strong> Retries are meant for <em>transient</em> failures. Retrying a deterministic error like a duplicate key, a validation failure or a 400 can never succeed, it just multiplies the cost of failing. And always know your retry library’s default. In more than one of them, an <em>empty</em> match list means “retry everything”, not “retry nothing”. The safe posture is an explicit allowlist of transient errors, deny by default.</p>
  </li>
  <li>
    <p><strong>A <code class="language-plaintext highlighter-rouge">findOrCreate</code> race is normal, handle it by reading, not by rewriting.</strong> The unique constraint is doing its job when it rejects the second insert. The right response is to go and fetch the row that the winner created, which most ORMs already do for you.</p>
  </li>
  <li>
    <p><strong>Watch what you hold across an <code class="language-plaintext highlighter-rouge">await</code>.</strong> The event loop being free does not mean nothing is blocked. A connection, a lock, or a transaction that is pinned for 8 seconds is a scalability bug even when your CPU usage looks perfectly fine.</p>
  </li>
</ol>

<p>The final diff was one line. Finding which line took a lot longer, and honestly that is almost always the shape of a good debugging story.</p>]]></content><author><name>Amar Khamkar</name></author><category term="BACKEND" /><category term="DEBUGGING" /><category term="nodejs" /><category term="sequelize" /><category term="mysql" /><category term="race-condition" /><category term="retry" /><category term="performance" /><category term="backend" /><summary type="html"><![CDATA[A harmless race condition met a well meaning retry policy and turned into an 8 second latency spike. Here is how I traced it, and the one line fix.]]></summary></entry><entry><title type="html">DevOps Essentials Every Software Engineer Should Know</title><link href="https://blog.amarkhamkar.com/posts/DEVOPS-ESSENTIALS/" rel="alternate" type="text/html" title="DevOps Essentials Every Software Engineer Should Know" /><published>2026-03-14T18:30:00+00:00</published><updated>2026-03-14T18:30:00+00:00</updated><id>https://blog.amarkhamkar.com/posts/DEVOPS-ESSENTIALS</id><content type="html" xml:base="https://blog.amarkhamkar.com/posts/DEVOPS-ESSENTIALS/"><![CDATA[<p>DevOps often feels like a mysterious realm reserved for infrastructure engineers and system administrators.</p>

<p>But the reality is simple:</p>

<p>If your code runs on the internet, you are already part of DevOps.</p>

<p>Every software engineer — backend, frontend, or mobile — should understand how their code goes from a Git commit to running in production.</p>

<p>You don’t need to be a Kubernetes expert. But understanding the fundamentals of networking, containers, deployments, and monitoring will make you a significantly better engineer.</p>

<p>In this post, I’ll break down the DevOps concepts every engineer should know — with practical examples.</p>

<hr />

<h2 id="1-the-real-basics-how-networking-works">1. The Real Basics: How Networking Works</h2>

<p>Before we talk about deploying apps, we need to understand how they talk to each other. 
At the foundation is the <strong>TCP/IP</strong> (Transmission Control Protocol / Internet Protocol) model.</p>

<ul>
  <li><strong>IP Addresses</strong>: Think of this as the street address of a server.</li>
  <li><strong>Ports</strong>: If the IP is the street address, the port is the specific apartment number (e.g., Port 80 for HTTP, 443 for HTTPS, 5432 for PostgreSQL).</li>
  <li><strong>TCP</strong>: A reliable protocol that ensures data packets arrive correctly and in order. It uses a “three-way handshake” (SYN, SYN-ACK, ACK) to establish a connection before sending data.</li>
  <li><strong>DNS</strong>: The phonebook of the internet. It maps human-readable domains (like <code class="language-plaintext highlighter-rouge">google.com</code>) to IP addresses.</li>
</ul>

<p>Understanding these basics will save you hours of debugging when an API call fails with a “Connection Refused” or “CORS” error.</p>

<hr />

<h2 id="2-docker-basics">2. Docker Basics</h2>

<p>“It works on my machine!” are famous last words in software engineering. Enter <strong>Docker</strong>. Docker solves the “works on my machine” problem by packaging applications with all their dependencies.</p>

<h3 id="key-concepts">Key Concepts:</h3>
<ul>
  <li><strong>Image</strong>: A read-only template containing your code, runtime, libraries, and environment variables. Like a blueprint for a house.</li>
  <li><strong>Container</strong>: A running instance of an image. Like the actual built house you can live in.</li>
</ul>

<h3 id="sample-dockerfile">Sample Dockerfile</h3>
<p>Here’s a simple example of containerizing a Node.js application:</p>

<div class="language-dockerfile highlighter-rouge"><div class="highlight"><pre class="highlight"><code><table class="rouge-table"><tbody><tr><td class="rouge-gutter gl"><pre class="lineno">1
2
3
4
5
6
7
8
9
10
11
12
13
14
15
16
17
18
</pre></td><td class="rouge-code"><pre><span class="c"># 1. Use the official Node.js image as a base</span>
<span class="k">FROM</span><span class="s"> node:18-alpine</span>

<span class="c"># 2. Set the working directory inside the container</span>
<span class="k">WORKDIR</span><span class="s"> /app</span>

<span class="c"># 3. Copy package.json and install dependencies</span>
<span class="k">COPY</span><span class="s"> package*.json ./</span>
<span class="k">RUN </span>npm <span class="nb">install</span>

<span class="c"># 4. Copy the rest of the application code</span>
<span class="k">COPY</span><span class="s"> . .</span>

<span class="c"># 5. Build the application (if needed) and Expose the port</span>
<span class="k">EXPOSE</span><span class="s"> 3000</span>

<span class="c"># 6. Command to start the app</span>
<span class="k">CMD</span><span class="s"> ["npm", "start"]</span>
</pre></td></tr></tbody></table></code></pre></div></div>

<p>💡 <strong>Very High level of docker run command</strong></p>

<p>So, when we run the command <code class="language-plaintext highlighter-rouge">docker run my-app-image</code>, Docker performs the following steps:</p>

<ol>
  <li>Pull the image (if not available locally)</li>
  <li>Create a container from the image</li>
  <li>Start the container –&gt; Here Actually <code class="language-plaintext highlighter-rouge">npm start</code> is executed.</li>
</ol>

<p>So effectively:</p>

<p>Docker Image → becomes → Running Container</p>

<hr />

<h2 id="3-deployments-before-kubernetes">3. Deployments Before Kubernetes</h2>

<p>Kubernetes is great, but it’s overkill for many projects. Before jumping to K8s, it’s crucial to understand simpler deployment methods: the <strong>Single Shared Machine</strong> model.</p>

<p>Platforms like <strong>EC2 (AWS), Heroku, or Railway</strong> allow you to deploy your app onto a virtual machine (VM).</p>
<ul>
  <li><strong>Heroku / Railway</strong>: Abstract away the underlying servers (PaaS). You push code, and they build and run the Docker container for you effortlessly.</li>
  <li><strong>EC2</strong>: You get a raw virtual server (IaaS). You SSH into it, install Docker, pull your image, and run it.</li>
</ul>

<p>This model is perfect for MVPs and small-to-medium side projects before scaling horizontally.</p>

<details>
<summary><strong>Example of deployment on EC2</strong></summary>

<p><strong>Steps:</strong></p>

<ol>
<li>Create EC2 instance</li>
<li>SSH into machine</li>
</ol>

<pre><code class="language-bash">ssh ubuntu@server-ip</code></pre>

<p><strong>Install Docker</strong></p>

<pre><code class="language-bash">sudo apt install docker.io</code></pre>

<p><strong>Run container</strong></p>

<pre><code class="language-bash">docker run -d -p 80:3000 myapp</code></pre>

<p><strong>Traffic Flow</strong></p>

<pre>
User
  ↓
Internet
  ↓
EC2 Instance
  ↓
Docker Container
  ↓
Application
</pre>

</details>

<hr />

<h2 id="4-enter-kubernetes-k8s">4. Enter Kubernetes (K8s)</h2>

<p>When your application scales past a few VMs, managing them manually becomes a nightmare. Kubernetes is a container orchestration tool that automates deploying, scaling, and managing containerized apps.</p>

<h3 id="kubernetes-terminology">Kubernetes Terminology</h3>
<ul>
  <li><strong>Cluster</strong>: A cluster is simply a group of machines (i.e nodes) working together.</li>
  <li><strong>Node</strong>: A physical or virtual server (e.g., an EC2 instance or a machine) that runs your containers.
    <div class="language-plaintext highlighter-rouge"><div class="highlight"><pre class="highlight"><code><table class="rouge-table"><tbody><tr><td class="rouge-gutter gl"><pre class="lineno">1
2
3
4
</pre></td><td class="rouge-code"><pre>Cluster
 ├── Node 1 (EC2)
 ├── Node 2 (EC2)
 └── Node 3 (EC2)
</pre></td></tr></tbody></table></code></pre></div>    </div>
  </li>
  <li>
    <p><strong>Pod</strong>: 
The smallest deployable unit in K8s. A Pod usually contains one container (sometimes a few tightly coupled ones).</p>

    <p>In most cases:
<code class="language-plaintext highlighter-rouge">1 Pod = 1 Container</code></p>

    <p>Think of a Pod as:</p>
    <blockquote>
      <p>A wrapper around your Docker container.</p>
    </blockquote>
  </li>
</ul>

<p>The simplest way to picture it is a chain, where each layer only manages the one below it:</p>

<div class="language-plaintext highlighter-rouge"><div class="highlight"><pre class="highlight"><code><table class="rouge-table"><tbody><tr><td class="rouge-gutter gl"><pre class="lineno">1
</pre></td><td class="rouge-code"><pre>Deployment  ── manages ──►  ReplicaSet  ── manages ──►  Pods
</pre></td></tr></tbody></table></code></pre></div></div>

<ul>
  <li><strong>ReplicaSet</strong>: its only job is to keep a fixed number of identical Pods running. You say “I want 3”, and if a Pod crashes or gets deleted, the ReplicaSet immediately creates a new one to get back to 3. That is the whole job. A ReplicaSet knows nothing about versions or updates.</li>
  <li>
    <p><strong>Deployment</strong>: this sits one level above, and it is the thing you actually create in practice. Here is the key point that is easy to miss, a Deployment <strong>never creates Pods directly</strong>. It only watches your manifest. When something in it changes, like a new image version (<code class="language-plaintext highlighter-rouge">v1</code> to <code class="language-plaintext highlighter-rouge">v2</code>) or a different replica count, the Deployment creates a <strong>new ReplicaSet</strong>, and that ReplicaSet is what actually creates the new Pods. During an update it scales the new ReplicaSet up while scaling the old one down (a rolling update, so no downtime), and it keeps the old ReplicaSet around at 0 Pods so you can <strong>roll back</strong> instantly, it just scales the old one back up.</p>

    <p>So the easiest way to remember the difference:</p>
    <ul>
      <li><strong>ReplicaSet</strong> = keep N identical Pods alive.</li>
      <li><strong>Deployment</strong> = manage ReplicaSets so you can update and roll back safely.</li>
    </ul>

    <p>You almost always create a Deployment, and it creates and manages the ReplicaSet for you. You rarely make a ReplicaSet by hand. Here is what it looks like right after an update from v1 to v2:</p>

    <div class="language-plaintext highlighter-rouge"><div class="highlight"><pre class="highlight"><code><table class="rouge-table"><tbody><tr><td class="rouge-gutter gl"><pre class="lineno">1
2
3
</pre></td><td class="rouge-code"><pre>Deployment (my-app, now on v2)
  ├── ReplicaSet v2  →  3 Pods   (current)
  └── ReplicaSet v1  →  0 Pods   (kept, ready for instant rollback)
</pre></td></tr></tbody></table></code></pre></div>    </div>
  </li>
  <li><strong>DaemonSet</strong>: Ensures that every Node runs a copy of a specific Pod (often used for logging or monitoring agents). (Will cover this in detail very soon in some blog.)</li>
  <li>
    <p><strong>Workloads</strong>: A general term for applications running on K8s (Deployments, StatefulSets, DaemonSets).</p>

    <p>This can be confusing initially because <strong>Workload</strong> is not an actual Kubernetes resource.</p>

    <p>It is simply a category used by Kubernetes to describe objects that run applications, such as Deployments, StatefulSets, and DaemonSets.</p>

    <p>So, when someone says “workloads”, they mean Deployments, StatefulSets, DaemonSets, etc.</p>
    <div class="language-plaintext highlighter-rouge"><div class="highlight"><pre class="highlight"><code><table class="rouge-table"><tbody><tr><td class="rouge-gutter gl"><pre class="lineno">1
2
3
4
</pre></td><td class="rouge-code"><pre> Workloads
 ├── Deployment
 ├── StatefulSet
 └── DaemonSet
</pre></td></tr></tbody></table></code></pre></div>    </div>
  </li>
  <li><strong>ConfigMap / Secret</strong>: Ways to pass environment variables and sensitive data to your Pods without hardcoding them in the image.</li>
  <li><strong>Service</strong>: A stable network endpoint that exposes Pods. Since Pods are ephemeral (ip changes every time they are recreated) and can be recreated at any time, Services provide a consistent way to access them.</li>
</ul>

<h3 id="official-kubernetes-architecture-diagram">Official Kubernetes Architecture Diagram</h3>

<p><img src="https://kubernetes.io/images/docs/kubernetes-cluster-architecture.svg" alt="Kubernetes Architecture" /></p>

<h3 id="a-sample-k8s-deployment-manifest">A Sample K8s Deployment Manifest</h3>
<p>K8s uses YAML manifests to declare the desired state of the system:</p>

<div class="language-yaml highlighter-rouge"><div class="highlight"><pre class="highlight"><code><table class="rouge-table"><tbody><tr><td class="rouge-gutter gl"><pre class="lineno">1
2
3
4
5
6
7
8
9
10
11
12
13
14
15
16
17
18
19
20
</pre></td><td class="rouge-code"><pre><span class="na">apiVersion</span><span class="pi">:</span> <span class="s">apps/v1</span>
<span class="c1"># Kind in k8s YAML is like the type of resource</span>
<span class="na">kind</span><span class="pi">:</span> <span class="s">Deployment</span>  <span class="c1"># This is a workload resource</span>
<span class="na">metadata</span><span class="pi">:</span>
  <span class="na">name</span><span class="pi">:</span> <span class="s">frontend-deployment</span>
<span class="na">spec</span><span class="pi">:</span>
  <span class="na">replicas</span><span class="pi">:</span> <span class="m">3</span>  <span class="c1"># This is the ReplicaSet</span>
  <span class="na">selector</span><span class="pi">:</span>
    <span class="na">matchLabels</span><span class="pi">:</span>
      <span class="na">app</span><span class="pi">:</span> <span class="s">frontend</span>
  <span class="na">template</span><span class="pi">:</span>
    <span class="na">metadata</span><span class="pi">:</span>
      <span class="na">labels</span><span class="pi">:</span>
        <span class="na">app</span><span class="pi">:</span> <span class="s">frontend</span>
    <span class="na">spec</span><span class="pi">:</span>
      <span class="na">containers</span><span class="pi">:</span>
      <span class="pi">-</span> <span class="na">name</span><span class="pi">:</span> <span class="s">frontend-container</span>
        <span class="na">image</span><span class="pi">:</span> <span class="s">my-repo/frontend:v1.0.0</span>
        <span class="na">ports</span><span class="pi">:</span>
        <span class="pi">-</span> <span class="na">containerPort</span><span class="pi">:</span> <span class="m">80</span>
</pre></td></tr></tbody></table></code></pre></div></div>

<div class="language-yaml highlighter-rouge"><div class="highlight"><pre class="highlight"><code><table class="rouge-table"><tbody><tr><td class="rouge-gutter gl"><pre class="lineno">1
2
3
4
5
6
7
8
9
10
11
</pre></td><td class="rouge-code"><pre><span class="na">apiVersion</span><span class="pi">:</span> <span class="s">v1</span>
<span class="na">kind</span><span class="pi">:</span> <span class="s">Service</span>
<span class="na">metadata</span><span class="pi">:</span>
  <span class="na">name</span><span class="pi">:</span> <span class="s">frontend-service</span>
<span class="na">spec</span><span class="pi">:</span>
  <span class="na">selector</span><span class="pi">:</span>
    <span class="na">app</span><span class="pi">:</span> <span class="s">frontend</span>
  <span class="na">ports</span><span class="pi">:</span>
    <span class="pi">-</span> <span class="na">protocol</span><span class="pi">:</span> <span class="s">TCP</span>
      <span class="na">port</span><span class="pi">:</span> <span class="m">80</span>
      <span class="na">targetPort</span><span class="pi">:</span> <span class="m">80</span>
</pre></td></tr></tbody></table></code></pre></div></div>

<h3 id="often-confusing-differences">Often Confusing Differences</h3>

<details>
<summary><strong>Node vs Cluster</strong></summary>

<div>A <strong>Node</strong> is simply a single machine (physical or virtual) that runs containers.</div>

<div>A <strong>Cluster</strong> is a group of nodes working together and managed by Kubernetes.</div>
<br />
<div>Think of it like this:</div>
<ul>
<li>Node → one server</li>
<li>Cluster → a group of servers working together</li>
</ul>
<div>Example:</div>
<pre>
    Cluster  
    ├── Node 1 (EC2 instance)  
    ├── Node 2 (EC2 instance)  
    └── Node 3 (EC2 instance)
</pre>

<div>If one node fails, Kubernetes schedules the pods on another node automatically.</div>
</details>

<details>
<summary><strong>Pod vs Deployment</strong></summary>

<div>A <strong>Pod</strong> is the smallest runnable unit in Kubernetes.</div>

<div>It contains the actual container running your application.</div>

<div>A <strong>Deployment</strong> is a higher-level controller that manages pods.</div>
<br />
<div>For example:</div>
<div>If you declare:</div>
<strong>
replicas: 3
</strong>
<br />
<div>The Deployment ensures that <strong>3 pods are always running</strong>.</div>
<div>If one pod crashes:</div>
<div>Kubernetes automatically creates a new one.</div>
<br />
<div>So the relationship looks like this:</div>

<pre>
Deployment → manages → ReplicaSet → manages → Pods
</pre>
</details>

<details>
<summary><strong>Containerization vs Orchestration</strong></summary>

These two terms are often used together but solve different problems.
<br />
<strong>Containerization (Docker)</strong>
<br />
<div>Packages your application and dependencies into a portable container.</div>
<br />
<div>Example:</div>

<div>Docker container running a Node.js app.</div>
<br />
<strong>Orchestration (Kubernetes)</strong>
<br />
<div>Manages many containers across many machines.</div>
<br />
<div>It handles things like:</div>

<ul>
<li>scaling</li>
<li>restarting failed containers</li>
<li>service discovery</li>
<li>rolling deployments</li>
</ul>
<br />
<div>Think of it like this:</div>
<div>Docker --&gt; packages the app</div>
<div>Kubernetes --&gt; runs and manages the app at scale</div>
</details>

<h2 id="5-which-tools-to-use-for-k8s--eks">5. Which Tools to Use for K8s / EKS?</h2>

<p>Managing K8s via CLI (<code class="language-plaintext highlighter-rouge">kubectl</code>) can be overwhelming to visualize. There are some incredible tools to help engineers manage clusters effectively:</p>

<ul>
  <li>
    <p><strong>Lens</strong>: Often called the “Kubernetes IDE”. It provides a beautiful, native desktop UI to view Pods, logs, configurations, and cluster metrics instantly.
<em>(Tip: If you’re using Lens, check out its intuitive features for port-forwarding and inspecting secrets.)</em></p>

    <p><img src="/assets/img/part-of-devops-every-se/lens_software.png" alt="Lens" /></p>
  </li>
  <li>
    <p><strong>k9s</strong>: A terminal-based UI to interact with your clusters. If you prefer to never leave your terminal but want a visual dashboard, k9s is unmatched for speed.
<img src="/assets/img/part-of-devops-every-se/k9s.png" alt="k9s" /></p>
  </li>
</ul>

<details>
<summary>Some K9s shortcuts😉</summary>
<table>
<thead>
<tr>
<th>Key</th>
<th>Action</th>
</tr>
</thead>
<tbody>
<tr>
<td>:pods</td>
<td>View pods</td>
</tr>
<tr>
<td>:services</td>
<td>View services</td>
</tr>
<tr>
<td>:deployments</td>
<td>View deployments</td>
</tr>
<tr>
<td>l</td>
<td>View logs</td>
</tr>
<tr>
<td>s</td>
<td>Shell into pod</td>
</tr>
<tr>
<td>/</td>
<td>Search</td>
</tr>
<tr>
</tr>
</tbody>
</table>
</details>
<hr />

<h2 id="6-infrastructure-as-code-terraform">6. Infrastructure as Code: Terraform</h2>

<p><strong>Terraform</strong> allows you to write code to provision infrastructure (like AWS EKS clusters, databases, and network firewalls) instead of clicking through web consoles. 
It uses HCL (HashiCorp Configuration Language) to declare what resources you want, and Terraform figures out how to create, update, or delete them to match your code.</p>

<div class="language-hcl highlighter-rouge"><div class="highlight"><pre class="highlight"><code><table class="rouge-table"><tbody><tr><td class="rouge-gutter gl"><pre class="lineno">1
2
3
4
5
6
7
8
9
10
11
12
13
14
15
16
17
18
19
20
21
</pre></td><td class="rouge-code"><pre><span class="nx">provider</span> <span class="s2">"aws"</span> <span class="p">{</span>
  <span class="nx">region</span> <span class="o">=</span> <span class="s2">"ap-south-1"</span>
<span class="p">}</span>

<span class="nx">resource</span> <span class="s2">"aws_s3_bucket"</span> <span class="s2">"app_bucket"</span> <span class="p">{</span>
  <span class="nx">bucket</span> <span class="o">=</span> <span class="s2">"my-app-storage"</span>
<span class="p">}</span>

<span class="nx">resource</span> <span class="s2">"aws_db_instance"</span> <span class="s2">"app_db"</span> <span class="p">{</span>
  <span class="nx">identifier</span> <span class="o">=</span> <span class="s2">"app-db"</span>

  <span class="nx">engine</span> <span class="o">=</span> <span class="s2">"postgres"</span>
  <span class="nx">instance_class</span> <span class="o">=</span> <span class="s2">"db.t3.micro"</span>

  <span class="nx">allocated_storage</span> <span class="o">=</span> <span class="mi">20</span>
  <span class="nx">username</span> <span class="o">=</span> <span class="s2">"admin"</span>
  <span class="nx">password</span> <span class="o">=</span> <span class="s2">"password123"</span>

  <span class="nx">skip_final_snapshot</span> <span class="o">=</span> <span class="kc">true</span>
<span class="err">}</span>

</pre></td></tr></tbody></table></code></pre></div></div>

<p>Run:</p>

<div class="language-bash highlighter-rouge"><div class="highlight"><pre class="highlight"><code><table class="rouge-table"><tbody><tr><td class="rouge-gutter gl"><pre class="lineno">1
2
3
</pre></td><td class="rouge-code"><pre>terraform init
terraform plan <span class="c"># shows what will be created</span>
terraform apply <span class="c"># creates the resources</span>
</pre></td></tr></tbody></table></code></pre></div></div>

<details> <summary>Advanced: Reusable Terraform Modules</summary> 

In larger teams &amp; big companies, engineers don't rewrite terraform resources repeatedly. So, instead they create reusable modules.
<br />

<strong>Example structure:</strong>
<br />

<pre>
terraform-modules/
   ├── s3-module
   ├── rds-module
   └── eks-module
</pre>
<br />
<strong>Example usage:</strong>
<br />

<pre>
module "app_s3" {
  source = "../modules/s3"
  bucket_name = "team-storage"
}
</pre>
This allows teams to reuse infrastructure safely.

</details>
<hr />

<h2 id="7-continuous-integration-ci">7. Continuous Integration (CI)</h2>

<p>Continuous Integration (CI) is the practice of automatically building and testing your code whenever changes are pushed to a repository.</p>

<p>Instead of manually running builds and tests, CI systems automate the process and provide quick feedback to developers.</p>

<p>Typical CI flow:</p>

<div class="language-plaintext highlighter-rouge"><div class="highlight"><pre class="highlight"><code><table class="rouge-table"><tbody><tr><td class="rouge-gutter gl"><pre class="lineno">1
2
3
4
5
6
7
8
9
10
11
</pre></td><td class="rouge-code"><pre>Developer pushes code → GitHub
↓
CI pipeline triggered
↓
Install dependencies
↓
Run tests
↓
Build Docker image
↓
Push image to container registry
</pre></td></tr></tbody></table></code></pre></div></div>

<p>One of the most widely used CI tools is <strong>Jenkins</strong>.</p>

<p>Jenkins runs pipelines defined using a Groovy-based DSL called a <strong>Jenkinsfile</strong>.</p>

<p>This allows you to version your build pipeline alongside your application code.</p>

<details>
<summary><strong>Example Jenkins Pipeline (Groovy)</strong></summary>

<pre><code class="language-groovy">
pipeline {
  agent any
  stages {
    stage('Checkout Code') {
      steps {
        git 'https://github.com/org/project.git'
      }
    }

    stage('Install Dependencies') {
      steps {
        sh 'npm install'
      }
    }

    stage('Run Tests') {
      steps {
        sh 'npm test'
      }
    }

    stage('Build Docker Image') {
      steps {
        sh 'docker build -t myapp:${BUILD_NUMBER} .'
      }
    }

    stage('Push Image') {
      steps {
        sh 'docker push myrepo/myapp:${BUILD_NUMBER}'
      }
    }
  }
}
</code></pre>

<p>This pipeline automatically builds and pushes a Docker image whenever a commit is made.</p>

<p>Modern alternatives to Jenkins include:</p>

<ul>
<li>GitHub Actions</li>
<li>GitLab CI</li>
<li>CircleCI</li>
<li>Buildkite</li>
</ul>

</details>

<h2 id="8-helm-fluxcd-and-gitops-automation">8. Helm, FluxCD, and GitOps Automation</h2>

<p>Once you have K8s and Terraform, how do you manage updates easily for the whole team?</p>

<h3 id="helm">Helm</h3>
<p>Helm is the package manager for Kubernetes. Instead of writing dozens of YAML files (like the deployment manifest above), Helm uses Chart templates. You can install an entire database with a single command: <code class="language-plaintext highlighter-rouge">helm install my-db bitnami/postgresql</code>.</p>

<details>
<summary><strong>Why Helm is Needed</strong></summary>

<p>When working with Kubernetes, teams often maintain multiple environments:</p>

<ul>
<li>development</li>
<li>staging</li>
<li>production</li>
</ul>

<p>Without Helm, engineers often end up duplicating manifests:</p>

<pre>
deployment-dev.yaml
deployment-staging.yaml
deployment-prod.yaml
</pre>

<div>This becomes difficult to maintain.</div>

<div>Helm solves this problem using <strong>templates and values</strong>.</div>
<br />
<div><strong>values.yaml</strong></div>

<pre><code>
replicaCount: 3
image: my-app:v1
</code></pre>

<div><strong>Deployment template</strong></div>


<div>replicas: {{ .Values.replicaCount }}</div>
<div>image: {{ .Values.image }}</div>


<br />

<div>Different environments simply override values.</div>

<div><strong>values-prod.yaml</strong></div>

<div>replicaCount: 10</div>
<br />
<div>Deploy using:</div>

<pre><code>
helm install my-app ./chart
</code></pre>

<div>Helm allows teams to maintain reusable, versioned infrastructure templates.</div>

</details>

<h3 id="fluxcd--gitops">FluxCD &amp; GitOps</h3>
<p>In the past, engineers manually ran deployment scripts. Today, we use <strong>GitOps</strong>. Tools like <strong>FluxCD</strong> (or ArgoCD) run inside your K8s cluster and constantly monitor your Git repository. When you merge a PR to GitHub, FluxCD instantly updates the K8s cluster to match the new code.</p>

<h3 id="self-serve-architecture-for-teams">Self-Serve Architecture for Teams</h3>

<p>In larger teams, infrastructure should not become a bottleneck where developers constantly depend on DevOps engineers for deployments.</p>

<p>A common approach is to adopt a <strong>GitOps-driven self-serve architecture</strong>.</p>

<p>Typical repository structure:</p>

<div class="language-plaintext highlighter-rouge"><div class="highlight"><pre class="highlight"><code><table class="rouge-table"><tbody><tr><td class="rouge-gutter gl"><pre class="lineno">1
2
3
4
5
6
7
</pre></td><td class="rouge-code"><pre>repo/
├── terraform-resources/
│ ├── s3
│ ├── networking
│ └── rds
└── k8s-resources/
    ├── helm-charts
</pre></td></tr></tbody></table></code></pre></div></div>

<p>Infrastructure resources such as clusters, networks, and databases are managed using <strong>Terraform</strong>.</p>

<p>Application-level deployments are managed using <strong>Kubernetes manifests or Helm charts</strong>.</p>

<p>Developers typically work with long-lived branches such as:</p>

<ul>
  <li>staging</li>
  <li>regression</li>
  <li>production</li>
</ul>

<p>When changes are merged into these branches, <strong>FluxCD continuously monitors the repository</strong>.</p>

<p>If Flux detects changes in Kubernetes manifests or Helm charts, it automatically synchronizes those changes to the Kubernetes cluster.</p>

<p>This ensures:</p>

<ul>
  <li>Git becomes the single source of truth</li>
  <li>Deployments are automated</li>
  <li>Infrastructure changes remain auditable</li>
</ul>

<p><img src="/assets/img/part-of-devops-every-se/gitops.png" alt="Gitops Working" /></p>

<h2 id="9-observability-how-the-elk-stack-works">9. Observability: How the ELK Stack Works</h2>

<p>Deploying code is only half the battle. Knowing what it’s doing in production is the other half.
The <strong>ELK Stack</strong> is the industry standard for centralized logging:</p>
<ol>
  <li><strong>E - Elasticsearch</strong>: A powerful search engine that stores your logs.</li>
  <li><strong>L - Logstash</strong> (or fluentd/fluentbit): The data pipeline that collects logs from your K8s Pods, parses them, and sends them to Elasticsearch.</li>
  <li><strong>K - Kibana</strong>: The UI dashboard where you can filter, search, and visualize your application logs.</li>
</ol>

<p>When your app throws error 500s, you go to Kibana to read the exact stack trace.</p>

<hr />

<h2 id="10-metrics-prometheus-grafana--time-series-databases">10. Metrics: Prometheus, Grafana &amp; Time Series Databases</h2>

<p>While ELK handles <em>logs</em> (text), <strong>Prometheus and Grafana</strong> handle <em>metrics</em> (numbers over time).</p>

<ul>
  <li><strong>Time Series Database (TSDB)</strong>: A database optimized for storing data timestamp by timestamp. Perfect for “CPU usage per second”.</li>
  <li><strong>Prometheus</strong>: It scrapes metrics from your applications and stores them in its TSDB.</li>
  <li><strong>Grafana</strong>: Plugs into Prometheus and visualizes the data via beautiful charts and gauges.</li>
</ul>

<p><strong>How to create dashboards</strong>: In Grafana, you write PromQL (Prometheus Query Language) queries (e.g., <code class="language-plaintext highlighter-rouge">rate(http_requests_total[5m])</code>) to pull data and put it on a graph. You can then set alerts to ping your team’s Slack if CPU usage exceeds 90%.</p>

<h3 id="how-metrics-collection-works">How Metrics Collection Works</h3>

<p>The monitoring flow typically looks like this:</p>

<div class="language-plaintext highlighter-rouge"><div class="highlight"><pre class="highlight"><code><table class="rouge-table"><tbody><tr><td class="rouge-gutter gl"><pre class="lineno">1
2
3
4
5
6
7
8
9
</pre></td><td class="rouge-code"><pre>Application 
   ↓
/metrics --&gt; Prometheus scrapes metrics 
   ↓
Metrics stored in TSDB 
   ↓
Grafana queries Prometheus 
   ↓
Dashboards visualize data
</pre></td></tr></tbody></table></code></pre></div></div>

<h3 id="step-1---expose-metrics">Step 1 - Expose Metrics</h3>
<p>Applications expose a <code class="language-plaintext highlighter-rouge">/metrics</code> endpoint.</p>

<p>Example output:</p>
<div class="language-plaintext highlighter-rouge"><div class="highlight"><pre class="highlight"><code><table class="rouge-table"><tbody><tr><td class="rouge-gutter gl"><pre class="lineno">1
2
3
</pre></td><td class="rouge-code"><pre>http_requests_total 10234
http_request_duration_seconds 0.34
cpu_usage_percent 45
</pre></td></tr></tbody></table></code></pre></div></div>

<h3 id="step-2---prometheus-scrapes-metrics">Step 2 - Prometheus Scrapes Metrics</h3>
<div class="language-plaintext highlighter-rouge"><div class="highlight"><pre class="highlight"><code><table class="rouge-table"><tbody><tr><td class="rouge-gutter gl"><pre class="lineno">1
2
3
4
5
6
7
8
</pre></td><td class="rouge-code"><pre>Prometheus periodically scrapes (pulls) metrics from the `/metrics` endpoint.

Prometheus configuration:

scrape_configs:
  - job_name: 'myapp'
    static_configs:
      - targets: ['myapp:8080']
</pre></td></tr></tbody></table></code></pre></div></div>

<p>Prometheus stores:</p>

<ul>
  <li>recent data in memory</li>
  <li>long-term data in a <strong>TSDB (Time Series Database)</strong></li>
</ul>

<h3 id="example-tsdb-systems">Example TSDB systems</h3>

<p>Common time series storage systems include:</p>

<ul>
  <li>Prometheus TSDB</li>
  <li><strong>VictoriaMetrics</strong></li>
  <li><strong>Thanos</strong></li>
  <li><strong>Cortex</strong></li>
</ul>

<p>These systems allow long-term storage and horizontal scaling of metrics.</p>

<h3 id="step-3---grafana-visualizes-data">Step 3 - Grafana Visualizes Data</h3>
<div class="language-plaintext highlighter-rouge"><div class="highlight"><pre class="highlight"><code><table class="rouge-table"><tbody><tr><td class="rouge-gutter gl"><pre class="lineno">1
2
3
4
5
6
7
8
9
10
</pre></td><td class="rouge-code"><pre>Grafana queries Prometheus using PromQL:

rate(http_requests_total[5m])

Creates dashboards with:

- Line charts
- Gauges
- Heatmaps
- Alerting rules
</pre></td></tr></tbody></table></code></pre></div></div>

<hr />

<h2 id="11-advanced-deployments-canary-vs-bluegreen">11. Advanced Deployments: Canary vs. Blue/Green</h2>

<p>“Push and pray” is dangerous. Modern deployment strategies minimize downtime and risk:</p>

<h3 id="bluegreen-deployment">Blue/Green Deployment</h3>
<p>Blue-Green deployment uses two identical environments to release new versions of an application safely.</p>

<ul>
  <li>Blue → the currently live production environment</li>
  <li>Green → the new environment where the updated version is deployed</li>
</ul>

<p>Both environments run the same infrastructure, but only one receives user traffic at a time.</p>

<h4 id="deployment-sequence">Deployment Sequence</h4>

<div class="language-plaintext highlighter-rouge"><div class="highlight"><pre class="highlight"><code><table class="rouge-table"><tbody><tr><td class="rouge-gutter gl"><pre class="lineno">1
2
3
4
5
6
7
8
</pre></td><td class="rouge-code"><pre>Step 1 — Current state

Users
  ↓
Blue (v1 - live)

Green (idle)
Step 2 — Deploy new version
</pre></td></tr></tbody></table></code></pre></div></div>

<div class="language-plaintext highlighter-rouge"><div class="highlight"><pre class="highlight"><code><table class="rouge-table"><tbody><tr><td class="rouge-gutter gl"><pre class="lineno">1
2
3
4
5
</pre></td><td class="rouge-code"><pre>Users
  ↓
Blue (v1 - live)

Green (v2 deployed but not receiving traffic)
</pre></td></tr></tbody></table></code></pre></div></div>

<div class="language-plaintext highlighter-rouge"><div class="highlight"><pre class="highlight"><code><table class="rouge-table"><tbody><tr><td class="rouge-gutter gl"><pre class="lineno">1
2
3
4
</pre></td><td class="rouge-code"><pre>Step 3 — Test Green environment

Run smoke tests, health checks, and integration tests
against the Green environment to ensure it is stable.
</pre></td></tr></tbody></table></code></pre></div></div>

<div class="language-plaintext highlighter-rouge"><div class="highlight"><pre class="highlight"><code><table class="rouge-table"><tbody><tr><td class="rouge-gutter gl"><pre class="lineno">1
2
3
4
5
6
7
</pre></td><td class="rouge-code"><pre>Step 4 — Switch traffic

Users
  ↓
Green (v2 - now live)

Blue (v1 - standby)
</pre></td></tr></tbody></table></code></pre></div></div>

<p>Once the new version is verified, the load balancer is switched so all traffic moves from Blue → Green.</p>

<h4 id="rollback">Rollback</h4>

<p>If any issue is detected after deployment, rollback is immediate.</p>

<div class="language-plaintext highlighter-rouge"><div class="highlight"><pre class="highlight"><code><table class="rouge-table"><tbody><tr><td class="rouge-gutter gl"><pre class="lineno">1
2
3
4
5
</pre></td><td class="rouge-code"><pre>Users
  ↓
Blue (v1 restored)

Green (v2 disabled)
</pre></td></tr></tbody></table></code></pre></div></div>

<h3 id="canary-deployment">Canary Deployment</h3>
<ul>
  <li>You route a small percentage of traffic (e.g., 5%) to the new version (the “Canary”).</li>
  <li>The remaining 95% stay on the stable version.</li>
  <li>You monitor the error rates and metrics on the Canary. If stable, you gradually increase traffic (10%, 25%, 50%, 100%).</li>
  <li><strong>Benefit</strong>: Lowest risk. Bugs only impact a small subset of users before being caught.</li>
</ul>

<hr />

<h2 id="12-cdn-and-edge-infrastructure">12. CDN and Edge Infrastructure</h2>

<p>When users access your application, every request doesn’t need to hit your origin server.</p>

<p>This is where a <strong>CDN (Content Delivery Network)</strong> comes into play.</p>

<p>A CDN is a globally distributed network of servers that caches and delivers content closer to users.</p>

<p>Instead of:</p>

<p>User → Origin Server</p>

<p>It becomes:</p>

<p>User → CDN Edge Server → Origin Server</p>

<p>If the content is cached at the edge, the request <strong>never reaches your origin server</strong>.</p>

<p>Benefits of using a CDN:</p>

<ul>
  <li>Faster content delivery</li>
  <li>Reduced load on your servers</li>
  <li>Built-in DDoS protection</li>
  <li>Edge caching of static assets</li>
  <li>TLS termination</li>
  <li>Web Application Firewall (WAF)</li>
</ul>

<p>One of the most popular CDN providers is <strong>Cloudflare</strong>.</p>

<h2 id="conclusion">Conclusion</h2>

<p>DevOps isn’t a single person’s job—it’s a culture and a set of practices. By understanding these concepts—networking, containerization, orchestration, and observability—you bridge the gap between “code completing” and “code delivering value to users reliably.”</p>

<p>Next time you see a <code class="language-plaintext highlighter-rouge">Dockerfile</code> or a <code class="language-plaintext highlighter-rouge">.yaml</code> manifest in your repository, you’ll know exactly what’s going on!</p>]]></content><author><name>Amar Khamkar</name></author><category term="DEVOPS" /><category term="LEARNINGS" /><category term="devops" /><category term="docker" /><category term="kubernetes" /><category term="infrastructure" /><category term="backend" /><category term="frontend" /><summary type="html"><![CDATA[A practical guide to the DevOps concepts every software engineer—yes, even frontend engineers—needs to understand.]]></summary><media:thumbnail xmlns:media="http://search.yahoo.com/mrss/" url="https://blog.amarkhamkar.com/assets/img/part-of-devops-every-se/gitops.png" /><media:content medium="image" url="https://blog.amarkhamkar.com/assets/img/part-of-devops-every-se/gitops.png" xmlns:media="http://search.yahoo.com/mrss/" /></entry><entry><title type="html">Memory Buffer Leaks in Node.js Streams: Hidden Risks and How to Avoid Them</title><link href="https://blog.amarkhamkar.com/posts/NODEJS-MEMORY-BUFFER-LEAK/" rel="alternate" type="text/html" title="Memory Buffer Leaks in Node.js Streams: Hidden Risks and How to Avoid Them" /><published>2025-08-25T00:00:00+00:00</published><updated>2025-08-25T00:00:00+00:00</updated><id>https://blog.amarkhamkar.com/posts/NODEJS-MEMORY-BUFFER-LEAK</id><content type="html" xml:base="https://blog.amarkhamkar.com/posts/NODEJS-MEMORY-BUFFER-LEAK/"><![CDATA[<p><strong>Streams</strong> in Node.js are incredibly powerful — they let you process data efficiently without loading everything into memory. But if they’re mishandled, you risk <strong>memory buffer leaks</strong>, where <strong>old data resurfaces in new responses</strong>.</p>

<p>This can lead to:</p>
<ul>
  <li>Corrupted API responses</li>
  <li>Sensitive information leaking into server logs</li>
  <li>Even <strong>other users data or secrets</strong> accidentally being exposed</li>
  <li>Hours of debugging headaches</li>
</ul>

<p>Let’s break this down with an example and then see how to fix it.</p>

<hr />

<h2 id="-the-danger-of-bufferallocunsafe">🚨 The Danger of Buffer.allocUnsafe</h2>

<p>Node.js uses <code class="language-plaintext highlighter-rouge">Buffer.allocUnsafe(size)</code> internally in places like <code class="language-plaintext highlighter-rouge">zlib.gunzip</code>.<br />
This is <strong>fast</strong>, but it does <strong>not clear memory</strong> — meaning it can reuse old memory blocks.</p>

<p>👉 If you don’t <strong>overwrite the full buffer</strong>, stale data remains and can “leak” into your output.</p>

<h3 id="demo-stale-memory-leak">Demo: Stale Memory Leak</h3>
<div class="language-js highlighter-rouge"><div class="highlight"><pre class="highlight"><code><table class="rouge-table"><tbody><tr><td class="rouge-gutter gl"><pre class="lineno">1
2
3
4
5
6
7
8
9
10
11
12
13
14
15
16
</pre></td><td class="rouge-code"><pre><span class="c1">// ❌ Demo: Showing stale memory leak</span>
<span class="c1">// Step 1: Write a large distinctive pattern</span>
<span class="kd">const</span> <span class="nx">secret</span> <span class="o">=</span> <span class="nx">Buffer</span><span class="p">.</span><span class="k">from</span><span class="p">(</span><span class="dl">"</span><span class="s2">🔥🔥🔥SUPER_SECRET🔥🔥🔥</span><span class="dl">"</span><span class="p">.</span><span class="nf">repeat</span><span class="p">(</span><span class="mi">100</span><span class="p">));</span>
<span class="nx">console</span><span class="p">.</span><span class="nf">log</span><span class="p">(</span><span class="dl">"</span><span class="s2">Original Secret:</span><span class="dl">"</span><span class="p">,</span> <span class="nx">secret</span><span class="p">.</span><span class="nf">toString</span><span class="p">().</span><span class="nf">slice</span><span class="p">(</span><span class="mi">0</span><span class="p">,</span> <span class="mi">50</span><span class="p">)</span> <span class="o">+</span> <span class="dl">"</span><span class="s2">...</span><span class="dl">"</span><span class="p">);</span>

<span class="c1">// Step 2: Force memory pressure</span>
<span class="kd">let</span> <span class="nx">garbage</span> <span class="o">=</span> <span class="p">[];</span>
<span class="k">for </span><span class="p">(</span><span class="kd">let</span> <span class="nx">i</span> <span class="o">=</span> <span class="mi">0</span><span class="p">;</span> <span class="nx">i</span> <span class="o">&lt;</span> <span class="mi">100000</span><span class="p">;</span> <span class="nx">i</span><span class="o">++</span><span class="p">)</span> <span class="p">{</span>
  <span class="nx">garbage</span><span class="p">.</span><span class="nf">push</span><span class="p">(</span><span class="nx">Buffer</span><span class="p">.</span><span class="k">from</span><span class="p">(</span><span class="dl">"</span><span class="s2">garbage</span><span class="dl">"</span><span class="p">));</span>
<span class="p">}</span>
<span class="nx">garbage</span> <span class="o">=</span> <span class="kc">null</span><span class="p">;</span>

<span class="c1">// Step 3: Unsafe allocation (uninitialized memory)</span>
<span class="kd">const</span> <span class="nx">leaky</span> <span class="o">=</span> <span class="nx">Buffer</span><span class="p">.</span><span class="nf">allocUnsafe</span><span class="p">(</span><span class="nx">secret</span><span class="p">.</span><span class="nx">length</span><span class="p">);</span>
<span class="nx">console</span><span class="p">.</span><span class="nf">log</span><span class="p">(</span><span class="dl">"</span><span class="s2">Leaky Buffer:</span><span class="dl">"</span><span class="p">,</span> <span class="nx">leaky</span><span class="p">.</span><span class="nf">toString</span><span class="p">().</span><span class="nf">slice</span><span class="p">(</span><span class="mi">0</span><span class="p">,</span> <span class="mi">50</span><span class="p">)</span> <span class="o">+</span> <span class="dl">"</span><span class="s2">...</span><span class="dl">"</span><span class="p">);</span>

</pre></td></tr></tbody></table></code></pre></div></div>

<p>Output:</p>
<div class="language-plaintext highlighter-rouge"><div class="highlight"><pre class="highlight"><code><table class="rouge-table"><tbody><tr><td class="rouge-gutter gl"><pre class="lineno">1
2
</pre></td><td class="rouge-code"><pre>Buffer 1: SECRET_DATA
Buffer 2 (dirty): 0�c0▒▒▒
</pre></td></tr></tbody></table></code></pre></div></div>
<p>That gibberish itself is proof that Node.js did not zero out the memory —
it’s showing raw, uninitialized bytes left over from previous allocations.</p>

<p>Even though we allocated a new buffer, Node.js reused the same memory block, causing old data (or arbitrary garbage) to resurface.</p>

<p>This isn’t a problem if you fully overwrite buf2.
But if you only partially fill it (for example, due to incorrect stream handling), stale data will remain and may leak into your output.</p>

<h2 id="-real-world-problem-handling-api-response-streams">🌐 Real-World Problem: Handling API Response Streams</h2>

<p>Many third-party APIs return data as a stream (for example, <code class="language-plaintext highlighter-rouge">https.get</code>, AWS SDKs, Google APIs).</p>

<p>If you mishandle this stream:</p>

<ul>
  <li><strong>Not consuming all chunks</strong></li>
  <li><strong>Not awaiting asynchronous reads</strong></li>
  <li><strong>Concatenating buffers incorrectly</strong></li>
</ul>

<p>… you risk ending up with <strong>partial data + old memory content</strong>.</p>

<h3 id="-wrong-way-naive-handling">❌ Wrong Way (Naive Handling)</h3>
<div class="language-js highlighter-rouge"><div class="highlight"><pre class="highlight"><code><table class="rouge-table"><tbody><tr><td class="rouge-gutter gl"><pre class="lineno">1
2
3
4
5
6
7
8
9
10
11
12
13
14
</pre></td><td class="rouge-code"><pre><span class="k">import</span> <span class="nx">https</span> <span class="k">from</span> <span class="dl">"</span><span class="s2">https</span><span class="dl">"</span><span class="p">;</span>

<span class="kd">function</span> <span class="nf">fetchData</span><span class="p">(</span><span class="nx">url</span><span class="p">)</span> <span class="p">{</span>
  <span class="k">return</span> <span class="k">new</span> <span class="nc">Promise</span><span class="p">((</span><span class="nx">resolve</span><span class="p">,</span> <span class="nx">reject</span><span class="p">)</span> <span class="o">=&gt;</span> <span class="p">{</span>
    <span class="nx">https</span><span class="p">.</span><span class="nf">get</span><span class="p">(</span><span class="nx">url</span><span class="p">,</span> <span class="p">(</span><span class="nx">res</span><span class="p">)</span> <span class="o">=&gt;</span> <span class="p">{</span>
      <span class="kd">let</span> <span class="nx">data</span> <span class="o">=</span> <span class="dl">""</span><span class="p">;</span>
      <span class="nx">res</span><span class="p">.</span><span class="nf">on</span><span class="p">(</span><span class="dl">"</span><span class="s2">data</span><span class="dl">"</span><span class="p">,</span> <span class="p">(</span><span class="nx">chunk</span><span class="p">)</span> <span class="o">=&gt;</span> <span class="p">{</span>
        <span class="nx">data</span> <span class="o">+=</span> <span class="nx">chunk</span><span class="p">;</span> <span class="c1">// ❌ mixing Buffers with strings!</span>
      <span class="p">});</span>
      <span class="nx">res</span><span class="p">.</span><span class="nf">on</span><span class="p">(</span><span class="dl">"</span><span class="s2">end</span><span class="dl">"</span><span class="p">,</span> <span class="p">()</span> <span class="o">=&gt;</span> <span class="nf">resolve</span><span class="p">(</span><span class="nx">data</span><span class="p">));</span>
      <span class="nx">res</span><span class="p">.</span><span class="nf">on</span><span class="p">(</span><span class="dl">"</span><span class="s2">error</span><span class="dl">"</span><span class="p">,</span> <span class="nx">reject</span><span class="p">);</span>
    <span class="p">});</span>
  <span class="p">});</span>
<span class="p">}</span>
</pre></td></tr></tbody></table></code></pre></div></div>
<p>This approach is unsafe because:</p>
<ul>
  <li><strong>Buffers are being coerced into strings</strong></li>
  <li><strong>Multibyte characters may get split across chunks</strong></li>
  <li><strong>Partial old data can sneak in when decoding</strong></li>
</ul>

<h3 id="-correct-way-consume-the-stream-with-for-awaitof">✅ Correct Way: Consume the Stream with <code class="language-plaintext highlighter-rouge">for await...of</code></h3>
<div class="language-js highlighter-rouge"><div class="highlight"><pre class="highlight"><code><table class="rouge-table"><tbody><tr><td class="rouge-gutter gl"><pre class="lineno">1
2
3
4
5
6
7
8
9
10
11
12
13
14
15
16
17
18
</pre></td><td class="rouge-code"><pre><span class="k">import</span> <span class="nx">https</span> <span class="k">from</span> <span class="dl">"</span><span class="s2">https</span><span class="dl">"</span><span class="p">;</span>

<span class="k">async</span> <span class="kd">function</span> <span class="nf">fetchData</span><span class="p">(</span><span class="nx">url</span><span class="p">)</span> <span class="p">{</span>
  <span class="k">return</span> <span class="k">new</span> <span class="nc">Promise</span><span class="p">((</span><span class="nx">resolve</span><span class="p">,</span> <span class="nx">reject</span><span class="p">)</span> <span class="o">=&gt;</span> <span class="p">{</span>
    <span class="nx">https</span><span class="p">.</span><span class="nf">get</span><span class="p">(</span><span class="nx">url</span><span class="p">,</span> <span class="k">async </span><span class="p">(</span><span class="nx">res</span><span class="p">)</span> <span class="o">=&gt;</span> <span class="p">{</span>
      <span class="k">try</span> <span class="p">{</span>
        <span class="kd">const</span> <span class="nx">chunks</span> <span class="o">=</span> <span class="p">[];</span>
        <span class="k">for</span> <span class="k">await </span><span class="p">(</span><span class="kd">const</span> <span class="nx">chunk</span> <span class="k">of</span> <span class="nx">res</span><span class="p">)</span> <span class="p">{</span>
          <span class="nx">chunks</span><span class="p">.</span><span class="nf">push</span><span class="p">(</span><span class="nx">chunk</span><span class="p">);</span> <span class="c1">// always handle Buffers</span>
        <span class="p">}</span>
        <span class="kd">const</span> <span class="nx">buffer</span> <span class="o">=</span> <span class="nx">Buffer</span><span class="p">.</span><span class="nf">concat</span><span class="p">(</span><span class="nx">chunks</span><span class="p">);</span>
        <span class="nf">resolve</span><span class="p">(</span><span class="nx">buffer</span><span class="p">.</span><span class="nf">toString</span><span class="p">(</span><span class="dl">"</span><span class="s2">utf8</span><span class="dl">"</span><span class="p">));</span> <span class="c1">// safe decoding</span>
      <span class="p">}</span> <span class="k">catch </span><span class="p">(</span><span class="nx">err</span><span class="p">)</span> <span class="p">{</span>
        <span class="nf">reject</span><span class="p">(</span><span class="nx">err</span><span class="p">);</span>
      <span class="p">}</span>
    <span class="p">});</span>
  <span class="p">});</span>
<span class="p">}</span>
</pre></td></tr></tbody></table></code></pre></div></div>
<p>Here we:</p>
<ul>
  <li>Use <code class="language-plaintext highlighter-rouge">for await...of</code> to <strong>consume the entire stream</strong></li>
  <li>Store <strong>raw Buffers</strong> in an array</li>
  <li>Combine them with <code class="language-plaintext highlighter-rouge">Buffer.concat()</code>, which correctly allocates <strong>fresh memory</strong></li>
</ul>

<h2 id="-streams-with-compression-zlib--gunzip">🎭 Streams with Compression (zlib / gunzip)</h2>

<p>The risk is higher with compressed streams, since <code class="language-plaintext highlighter-rouge">zlib.gunzip</code> uses <code class="language-plaintext highlighter-rouge">Buffer.allocUnsafe</code>.</p>

<h3 id="safe-usage">Safe Usage</h3>
<div class="language-js highlighter-rouge"><div class="highlight"><pre class="highlight"><code><table class="rouge-table"><tbody><tr><td class="rouge-gutter gl"><pre class="lineno">1
2
3
4
5
6
7
8
9
10
11
12
13
14
15
16
17
18
19
20
21
22
23
24
25
</pre></td><td class="rouge-code"><pre><span class="k">import</span> <span class="p">{</span> <span class="nx">createGunzip</span> <span class="p">}</span> <span class="k">from</span> <span class="dl">"</span><span class="s2">zlib</span><span class="dl">"</span><span class="p">;</span>
<span class="k">import</span> <span class="p">{</span> <span class="nx">pipeline</span> <span class="p">}</span> <span class="k">from</span> <span class="dl">"</span><span class="s2">stream/promises</span><span class="dl">"</span><span class="p">;</span>
<span class="k">import</span> <span class="nx">https</span> <span class="k">from</span> <span class="dl">"</span><span class="s2">https</span><span class="dl">"</span><span class="p">;</span>

<span class="k">async</span> <span class="kd">function</span> <span class="nf">fetchAndUnzip</span><span class="p">(</span><span class="nx">url</span><span class="p">)</span> <span class="p">{</span>
  <span class="k">return</span> <span class="k">new</span> <span class="nc">Promise</span><span class="p">((</span><span class="nx">resolve</span><span class="p">,</span> <span class="nx">reject</span><span class="p">)</span> <span class="o">=&gt;</span> <span class="p">{</span>
    <span class="nx">https</span><span class="p">.</span><span class="nf">get</span><span class="p">(</span><span class="nx">url</span><span class="p">,</span> <span class="k">async </span><span class="p">(</span><span class="nx">res</span><span class="p">)</span> <span class="o">=&gt;</span> <span class="p">{</span>
      <span class="k">try</span> <span class="p">{</span>
        <span class="kd">const</span> <span class="nx">chunks</span> <span class="o">=</span> <span class="p">[];</span>
        <span class="kd">const</span> <span class="nx">gunzip</span> <span class="o">=</span> <span class="nf">createGunzip</span><span class="p">();</span>

        <span class="k">await</span> <span class="nf">pipeline</span><span class="p">(</span><span class="nx">res</span><span class="p">,</span> <span class="nx">gunzip</span><span class="p">);</span>

        <span class="k">for</span> <span class="k">await </span><span class="p">(</span><span class="kd">const</span> <span class="nx">chunk</span> <span class="k">of</span> <span class="nx">gunzip</span><span class="p">)</span> <span class="p">{</span>
          <span class="nx">chunks</span><span class="p">.</span><span class="nf">push</span><span class="p">(</span><span class="nx">chunk</span><span class="p">);</span>
        <span class="p">}</span>

        <span class="kd">const</span> <span class="nx">buffer</span> <span class="o">=</span> <span class="nx">Buffer</span><span class="p">.</span><span class="nf">concat</span><span class="p">(</span><span class="nx">chunks</span><span class="p">);</span>
        <span class="nf">resolve</span><span class="p">(</span><span class="nx">buffer</span><span class="p">.</span><span class="nf">toString</span><span class="p">(</span><span class="dl">"</span><span class="s2">utf8</span><span class="dl">"</span><span class="p">));</span>
      <span class="p">}</span> <span class="k">catch </span><span class="p">(</span><span class="nx">err</span><span class="p">)</span> <span class="p">{</span>
        <span class="nf">reject</span><span class="p">(</span><span class="nx">err</span><span class="p">);</span>
      <span class="p">}</span>
    <span class="p">});</span>
  <span class="p">});</span>
<span class="p">}</span>
</pre></td></tr></tbody></table></code></pre></div></div>
<p>Here, we pipe the response through <code class="language-plaintext highlighter-rouge">gunzip</code>, and again collect all buffers safely.</p>

<h2 id="-best-practices-to-avoid-buffer-leaks">✅ Best Practices to Avoid Buffer Leaks</h2>
<ul>
  <li>Always <strong>consume the stream fully</strong> (<code class="language-plaintext highlighter-rouge">for await...of</code> or <code class="language-plaintext highlighter-rouge">pipeline</code>)</li>
  <li>Never mix <strong>Buffers with strings mid-stream</strong></li>
  <li>Use <code class="language-plaintext highlighter-rouge">Buffer.concat(chunks)</code> — don’t manually slice or reuse old buffers</li>
  <li>For sensitive data, prefer <code class="language-plaintext highlighter-rouge">Buffer.alloc()</code> (<strong>zero-filled</strong>) instead of <code class="language-plaintext highlighter-rouge">Buffer.allocUnsafe()</code></li>
  <li>Be cautious when decompressing — <strong>partial/incomplete streams can expose old memory contents</strong></li>
</ul>

<h2 id="-final-thoughts">📝 Final Thoughts</h2>

<p><strong>Streams in Node.js</strong> are powerful, but subtle mistakes can cause old memory contents to reappear in your outputs or logs.</p>
<ul>
  <li>Always <strong>handle streams properly</strong></li>
  <li>Be <strong>careful with compression/decompression</strong></li>
  <li>Remember that <code class="language-plaintext highlighter-rouge">Buffer.allocUnsafe</code> is <strong>unsafe</strong> for a reason</li>
</ul>]]></content><author><name>Amar Khamkar</name></author><category term="Backend engineering" /><category term="NODEJS" /><category term="nodejs" /><category term="streams" /><category term="buffer" /><category term="memory" /><category term="debugging" /><category term="zlib" /><summary type="html"><![CDATA[How mishandling Node.js streams can cause memory buffer leaks, stale data exposure, and how to fix them.]]></summary></entry><entry><title type="html">How I Cut My Hosting Costs by Over 80% Without Sacrificing Performance</title><link href="https://blog.amarkhamkar.com/posts/CALCONT-COST-CUSTTING/" rel="alternate" type="text/html" title="How I Cut My Hosting Costs by Over 80% Without Sacrificing Performance" /><published>2025-05-27T00:00:00+00:00</published><updated>2025-05-27T00:00:00+00:00</updated><id>https://blog.amarkhamkar.com/posts/CALCONT-COST-CUSTTING</id><content type="html" xml:base="https://blog.amarkhamkar.com/posts/CALCONT-COST-CUSTTING/"><![CDATA[<p>Running a personal project like <a href="https://calcont.in">calcont.in</a> that receives 30k+ monthly visitors can come with hidden infrastructure costs, especially if you’re using platforms with limited free tiers like Heroku. In this post, I’ll walk you through how I reduced my deployment costs by <strong>$10/month</strong> (that’s <strong>$120/year</strong>), while improving reliability and performance.</p>

<hr />

<h2 id="-previous-setup-heroku--postgresql">💸 Previous Setup: Heroku + PostgreSQL</h2>

<p>Until recently, I was using Heroku’s hobby plan setup:</p>

<ul>
  <li><strong>$7/month</strong>: Heroku Dyno (limited RAM, not ideal for traffic spikes)</li>
  <li><strong>$5/month</strong>: Heroku Postgres Hobby Dev</li>
</ul>

<p>Total: <strong>$12/month</strong></p>

<p><img src="/assets/img/calcont-costcutting/heroku.png" alt="Heroku setup cost" /></p>

<p>While Heroku is beginner-friendly, the hobby dynos provide <strong>low memory</strong> and have limitations under heavy traffic. Performance wasn’t consistent during peak hours, and there’s not much clarity about how compute resources are allocated behind the scenes.</p>

<hr />

<h2 id="-step-1-migrated-postgresql-to-supabase">🚀 Step 1: Migrated PostgreSQL to Supabase</h2>

<p>Supabase offers a generous free tier for PostgreSQL databases, and since calcont.in only uses the DB for:</p>
<ul>
  <li>User sign-ups (~10/month)</li>
  <li>Contact form submissions (~50 in total)</li>
</ul>

<p>It made perfect sense to migrate to Supabase. Minimal usage, no cost, and easy setup.</p>

<hr />

<h2 id="-step-2-deployment-experiment---google-cloud-serverless">🔄 Step 2: Deployment Experiment - Google Cloud Serverless</h2>

<p>Next, I explored Google Cloud’s serverless options by estimating CPU and request costs. While it looked affordable on paper, real-world deployment revealed <strong>unexpectedly high costs</strong>.</p>

<p>I quickly moved on.</p>

<hr />

<h2 id="-step-3-found-the-sweet-spot-with-railway">💡 Step 3: Found the Sweet Spot with Railway</h2>

<p>I discovered <a href="https://railway.app">Railway</a> and tried their <strong>$5/month hobby plan</strong>, which includes:</p>

<ul>
  <li><strong>8 GB RAM</strong></li>
  <li><strong>8 vCPUs</strong></li>
  <li>Supports Dockerfile-based deployment</li>
  <li>Pay-as-you-go pricing model</li>
</ul>

<p>Actual cost for my usage? Just <strong>$2.50–$3/month</strong>!<br />
That’s <strong>~$10/month saved</strong>, and the platform offers:</p>
<ul>
  <li><strong>Better resource allocation</strong></li>
  <li><strong>Fewer crashes or slowdowns</strong></li>
  <li><strong>Predictable pricing with usage caps</strong> to avoid surprise bills</li>
</ul>

<blockquote>
  <p><strong>Note:</strong> While testing Railway, I kept my Heroku setup running in parallel as a fallback. This gave me confidence to monitor traffic, analyze real-world pricing, and make the switch only when I was sure it worked smoothly.</p>
</blockquote>

<hr />

<h2 id="-bonus-securing-the-admin-panel-with-cloudflare-one">🔐 Bonus: Securing the Admin Panel with Cloudflare One</h2>

<p>To protect sensitive parts of my app (like <code class="language-plaintext highlighter-rouge">/admin</code>), I set up <strong>Cloudflare One Access</strong>, which:</p>
<ul>
  <li>Prevents public exposure of admin endpoints</li>
  <li>Offers Zero Trust protection for free (up to 50 users)</li>
</ul>

<p>No need to write middleware or complex auth layers!</p>

<hr />

<h2 id="-optimization-removed-external-cache-layer">🧠 Optimization: Removed External Cache Layer</h2>

<p>In the Heroku setup, I was using <code class="language-plaintext highlighter-rouge">memcachier</code> for caching some operation. But in the new setup:</p>
<ul>
  <li>As, only <strong>one feature</strong> uses caching. So, Maintaining an external cache service didn’t make sense</li>
  <li>So I switched to <strong>Django’s in-memory RAM caching</strong>, which is enough and <strong>free</strong></li>
</ul>

<hr />

<h2 id="-final-comparison">📊 Final Comparison</h2>

<table>
  <thead>
    <tr>
      <th>Feature</th>
      <th>Heroku (Before)</th>
      <th>Railway + Supabase (After)</th>
    </tr>
  </thead>
  <tbody>
    <tr>
      <td>Cost</td>
      <td>$12/month</td>
      <td>$2.50–$3/month</td>
    </tr>
    <tr>
      <td>RAM</td>
      <td>512MB</td>
      <td>up to 8 GB</td>
    </tr>
    <tr>
      <td>CPU</td>
      <td>limited</td>
      <td>8 vCpus</td>
    </tr>
    <tr>
      <td>Database</td>
      <td>Heroku PG ($5)</td>
      <td>Supabase (Free tier)</td>
    </tr>
  </tbody>
</table>

<hr />

<h2 id="-github-reference">📦 GitHub Reference</h2>

<p>You can check the actual PR here that contains the migration and deployment updates:<br />
🔗 <a href="https://github.com/calcont/calcont.in/pull/115">calcont.in/pull/115</a></p>

<hr />

<h2 id="-tldr">🧾 TL;DR</h2>

<ul>
  <li>Migrated DB to Supabase (free)</li>
  <li>Moved hosting to Railway ($2.5–$3/month)</li>
  <li>Secured admin route with Cloudflare One</li>
  <li>Removed unnecessary caching layer</li>
  <li>Saved <strong>$120/year</strong> while improving reliability</li>
</ul>

<p>If you’re hosting a personal project and not doing heavy DB operations, <strong>you can save a lot</strong> by evaluating these alternatives. Don’t pay for what you don’t need.</p>

<hr />

<p><em>Have questions or want to share your own infra cost-cutting tips? Drop a comment or reach out via GitHub!</em></p>]]></content><author><name>Amar Khamkar</name></author><category term="COST_OPTIMIZATION" /><category term="cost-saving" /><category term="hosting" /><category term="infra" /><category term="deployment" /><category term="heroku-alternatives" /><category term="supabase" /><category term="railway" /><summary type="html"><![CDATA[A breakdown of how I migrated from Heroku to a more cost-effective stack using Supabase, Railway while maintaining performance for calcont.in.]]></summary><media:thumbnail xmlns:media="http://search.yahoo.com/mrss/" url="https://blog.amarkhamkar.com/assets/img/calcont-costcutting/main.png" /><media:content medium="image" url="https://blog.amarkhamkar.com/assets/img/calcont-costcutting/main.png" xmlns:media="http://search.yahoo.com/mrss/" /></entry></feed>