DevOps Essentials Every Software Engineer Should Know
A practical guide to the DevOps concepts every software engineer—yes, even frontend engineers—needs to understand.
DevOps often feels like a mysterious realm reserved for infrastructure engineers and system administrators.
But the reality is simple:
If your code runs on the internet, you are already part of DevOps.
Every software engineer — backend, frontend, or mobile — should understand how their code goes from a Git commit to running in production.
You don’t need to be a Kubernetes expert. But understanding the fundamentals of networking, containers, deployments, and monitoring will make you a significantly better engineer.
In this post, I’ll break down the DevOps concepts every engineer should know — with practical examples.
1. The Real Basics: How Networking Works
Before we talk about deploying apps, we need to understand how they talk to each other. At the foundation is the TCP/IP (Transmission Control Protocol / Internet Protocol) model.
- IP Addresses: Think of this as the street address of a server.
- Ports: If the IP is the street address, the port is the specific apartment number (e.g., Port 80 for HTTP, 443 for HTTPS, 5432 for PostgreSQL).
- TCP: A reliable protocol that ensures data packets arrive correctly and in order. It uses a “three-way handshake” (SYN, SYN-ACK, ACK) to establish a connection before sending data.
- DNS: The phonebook of the internet. It maps human-readable domains (like
google.com) to IP addresses.
Understanding these basics will save you hours of debugging when an API call fails with a “Connection Refused” or “CORS” error.
2. Docker Basics
“It works on my machine!” are famous last words in software engineering. Enter Docker. Docker solves the “works on my machine” problem by packaging applications with all their dependencies.
Key Concepts:
- Image: A read-only template containing your code, runtime, libraries, and environment variables. Like a blueprint for a house.
- Container: A running instance of an image. Like the actual built house you can live in.
Sample Dockerfile
Here’s a simple example of containerizing a Node.js application:
1
2
3
4
5
6
7
8
9
10
11
12
13
14
15
16
17
18
# 1. Use the official Node.js image as a base
FROM node:18-alpine

# 2. Set the working directory inside the container
WORKDIR /app

# 3. Copy package.json and install dependencies
COPY package*.json ./
RUN npm install

# 4. Copy the rest of the application code
COPY . .

# 5. Build the application (if needed) and Expose the port
EXPOSE 3000

# 6. Command to start the app
CMD ["npm", "start"]
💡 Very High level of docker run command
So, when we run the command docker run my-app-image, Docker performs the following steps:
- Pull the image (if not available locally)
- Create a container from the image
- Start the container –> Here Actually
npm startis executed.
So effectively:
Docker Image → becomes → Running Container
3. Deployments Before Kubernetes
Kubernetes is great, but it’s overkill for many projects. Before jumping to K8s, it’s crucial to understand simpler deployment methods: the Single Shared Machine model.
Platforms like EC2 (AWS), Heroku, or Railway allow you to deploy your app onto a virtual machine (VM).
- Heroku / Railway: Abstract away the underlying servers (PaaS). You push code, and they build and run the Docker container for you effortlessly.
- EC2: You get a raw virtual server (IaaS). You SSH into it, install Docker, pull your image, and run it.
This model is perfect for MVPs and small-to-medium side projects before scaling horizontally.
Example of deployment on EC2
Steps:
- Create EC2 instance
- SSH into machine
ssh ubuntu@server-ipInstall Docker
sudo apt install docker.ioRun container
docker run -d -p 80:3000 myappTraffic Flow
User
  ↓
Internet
  ↓
EC2 Instance
  ↓
Docker Container
  ↓
Application
4. Enter Kubernetes (K8s)
When your application scales past a few VMs, managing them manually becomes a nightmare. Kubernetes is a container orchestration tool that automates deploying, scaling, and managing containerized apps.
Kubernetes Terminology
- Cluster: A cluster is simply a group of machines (i.e nodes) working together.
- Node: A physical or virtual server (e.g., an EC2 instance or a machine) that runs your containers.
1
2
3
4
Cluster
 ├── Node 1 (EC2)
 ├── Node 2 (EC2)
 └── Node 3 (EC2)
-
Pod: The smallest deployable unit in K8s. A Pod usually contains one container (sometimes a few tightly coupled ones).
In most cases:
1 Pod = 1 ContainerThink of a Pod as:
A wrapper around your Docker container.
- Deployment: A declarative way to manage Pods. It ensures the right number of Pods are running at all times.
A deployment tells Kubernetes:
I want 3 copies of this application running at all times.If one pod crashes, Kubernetes automatically creates a new one. -
ReplicaSet: A ReplicaSet is the Kubernetes resource responsible for maintaining a stable number of identical Pods. It ensures that the number of running Pods always matches the desired replica count. ReplicaSets are usually not created directly by developers — they are automatically created and managed by Deployments.
For example:
1 2 3 4 5
Deployment └── ReplicaSet (replicas = 3) ├── Pod ├── Pod └── Pod - DaemonSet: Ensures that every Node runs a copy of a specific Pod (often used for logging or monitoring agents). (Will cover this in detail very soon in some blog.)
-
Workloads: A general term for applications running on K8s (Deployments, StatefulSets, DaemonSets).
This can be confusing initially because Workload is not an actual Kubernetes resource.
It is simply a category used by Kubernetes to describe objects that run applications, such as Deployments, StatefulSets, and DaemonSets.
So, when someone says “workloads”, they mean Deployments, StatefulSets, DaemonSets, etc.
1
2
3
4
 Workloads
 ├── Deployment
 ├── StatefulSet
 └── DaemonSet
- ConfigMap / Secret: Ways to pass environment variables and sensitive data to your Pods without hardcoding them in the image.
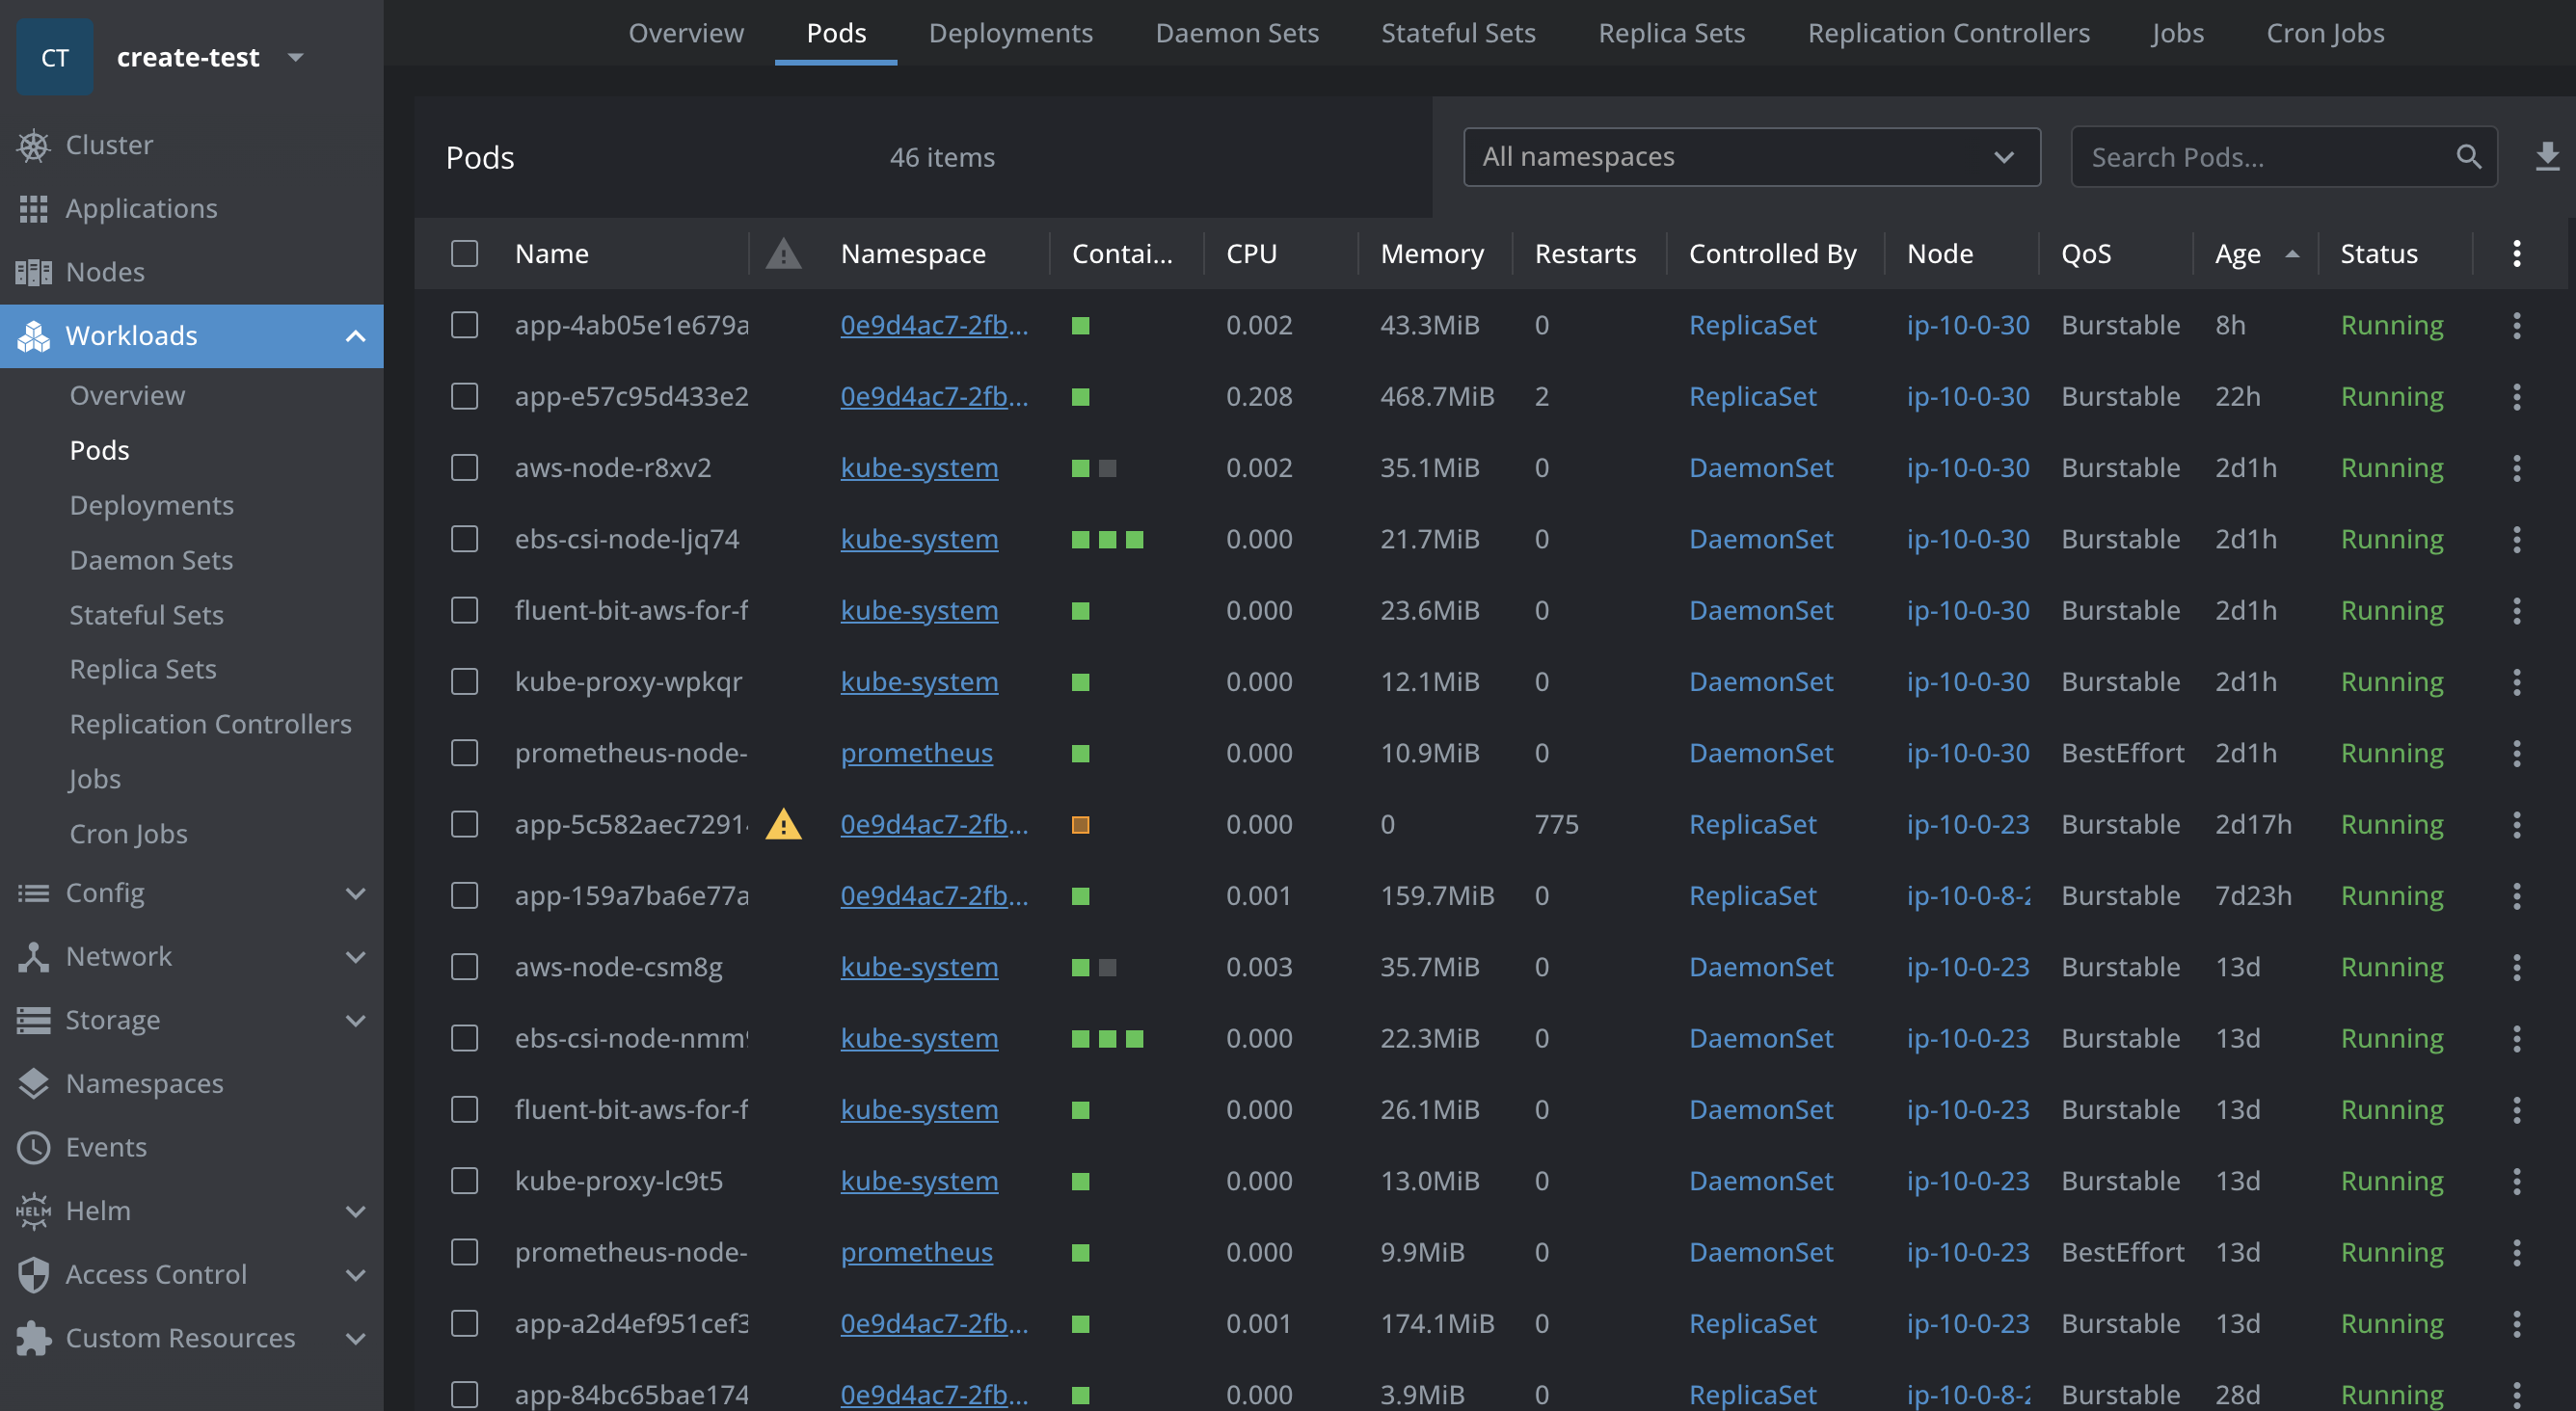
- Service: A stable network endpoint that exposes Pods. Since Pods are ephemeral (ip changes every time they are recreated) and can be recreated at any time, Services provide a consistent way to access them.
Official Kubernetes Architecture Diagram

A Sample K8s Deployment Manifest
K8s uses YAML manifests to declare the desired state of the system:
1
2
3
4
5
6
7
8
9
10
11
12
13
14
15
16
17
18
19
20
apiVersion: apps/v1
# Kind in k8s YAML is like the type of resource
kind: Deployment  # This is a workload resource
metadata:
  name: frontend-deployment
spec:
  replicas: 3  # This is the ReplicaSet
  selector:
    matchLabels:
      app: frontend
  template:
    metadata:
      labels:
        app: frontend
    spec:
      containers:
      - name: frontend-container
        image: my-repo/frontend:v1.0.0
        ports:
        - containerPort: 80
1
2
3
4
5
6
7
8
9
10
11
apiVersion: v1
kind: Service
metadata:
  name: frontend-service
spec:
  selector:
    app: frontend
  ports:
    - protocol: TCP
      port: 80
      targetPort: 80
Often Confusing Differences
Node vs Cluster
- Node → one server
- Cluster → a group of servers working together
    Cluster
    ├── Node 1 (EC2 instance)
    ├── Node 2 (EC2 instance)
    └── Node 3 (EC2 instance)
Pod vs Deployment
Deployment → manages → ReplicaSet → manages → Pods
Containerization vs Orchestration
These two terms are often used together but solve different problems.Containerization (Docker)
Orchestration (Kubernetes)
- scaling
- restarting failed containers
- service discovery
- rolling deployments
5. Which Tools to Use for K8s / EKS?
Managing K8s via CLI (kubectl) can be overwhelming to visualize. There are some incredible tools to help engineers manage clusters effectively:
-
Lens: Often called the “Kubernetes IDE”. It provides a beautiful, native desktop UI to view Pods, logs, configurations, and cluster metrics instantly. (Tip: If you’re using Lens, check out its intuitive features for port-forwarding and inspecting secrets.)
-
k9s: A terminal-based UI to interact with your clusters. If you prefer to never leave your terminal but want a visual dashboard, k9s is unmatched for speed.
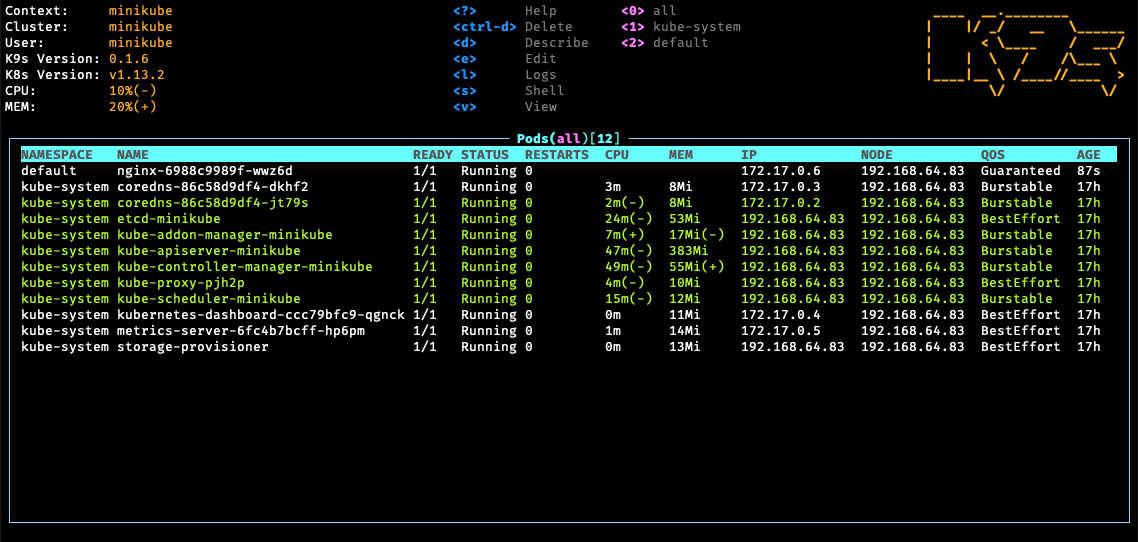
Some K9s shortcuts😉
| Key | Action |
|---|---|
| :pods | View pods |
| :services | View services |
| :deployments | View deployments |
| l | View logs |
| s | Shell into pod |
| / | Search |
6. Infrastructure as Code: Terraform
Terraform allows you to write code to provision infrastructure (like AWS EKS clusters, databases, and network firewalls) instead of clicking through web consoles. It uses HCL (HashiCorp Configuration Language) to declare what resources you want, and Terraform figures out how to create, update, or delete them to match your code.
1
2
3
4
5
6
7
8
9
10
11
12
13
14
15
16
17
18
19
20
21
provider "aws" {
  region = "ap-south-1"
}

resource "aws_s3_bucket" "app_bucket" {
  bucket = "my-app-storage"
}

resource "aws_db_instance" "app_db" {
  identifier = "app-db"

  engine = "postgres"
  instance_class = "db.t3.micro"

  allocated_storage = 20
  username = "admin"
  password = "password123"

  skip_final_snapshot = true
}
Run:
1
2
3
terraform init
terraform plan # shows what will be created
terraform apply # creates the resources
Advanced: Reusable Terraform Modules
In larger teams & big companies, engineers don't rewrite terraform resources repeatedly. So, instead they create reusable modules.Example structure:
terraform-modules/
   ├── s3-module
   ├── rds-module
   └── eks-module
Example usage:
module "app_s3" {
  source = "../modules/s3"
  bucket_name = "team-storage"
}
This allows teams to reuse infrastructure safely.
7. Continuous Integration (CI)
Continuous Integration (CI) is the practice of automatically building and testing your code whenever changes are pushed to a repository.
Instead of manually running builds and tests, CI systems automate the process and provide quick feedback to developers.
Typical CI flow:
1
2
3
4
5
6
7
8
9
10
11
Developer pushes code → GitHub
↓
CI pipeline triggered
↓
Install dependencies
↓
Run tests
↓
Build Docker image
↓
Push image to container registry
One of the most widely used CI tools is Jenkins.
Jenkins runs pipelines defined using a Groovy-based DSL called a Jenkinsfile.
This allows you to version your build pipeline alongside your application code.
Example Jenkins Pipeline (Groovy)
pipeline {
  agent any
  stages {
    stage('Checkout Code') {
      steps {
        git 'https://github.com/org/project.git'
      }
    }

    stage('Install Dependencies') {
      steps {
        sh 'npm install'
      }
    }

    stage('Run Tests') {
      steps {
        sh 'npm test'
      }
    }

    stage('Build Docker Image') {
      steps {
        sh 'docker build -t myapp:${BUILD_NUMBER} .'
      }
    }

    stage('Push Image') {
      steps {
        sh 'docker push myrepo/myapp:${BUILD_NUMBER}'
      }
    }
  }
}
This pipeline automatically builds and pushes a Docker image whenever a commit is made.
Modern alternatives to Jenkins include:
- GitHub Actions
- GitLab CI
- CircleCI
- Buildkite
8. Helm, FluxCD, and GitOps Automation
Once you have K8s and Terraform, how do you manage updates easily for the whole team?
Helm
Helm is the package manager for Kubernetes. Instead of writing dozens of YAML files (like the deployment manifest above), Helm uses Chart templates. You can install an entire database with a single command: helm install my-db bitnami/postgresql.
Why Helm is Needed
When working with Kubernetes, teams often maintain multiple environments:
- development
- staging
- production
Without Helm, engineers often end up duplicating manifests:
deployment-dev.yaml
deployment-staging.yaml
deployment-prod.yaml
replicaCount: 3
image: my-app:v1
helm install my-app ./chart
FluxCD & GitOps
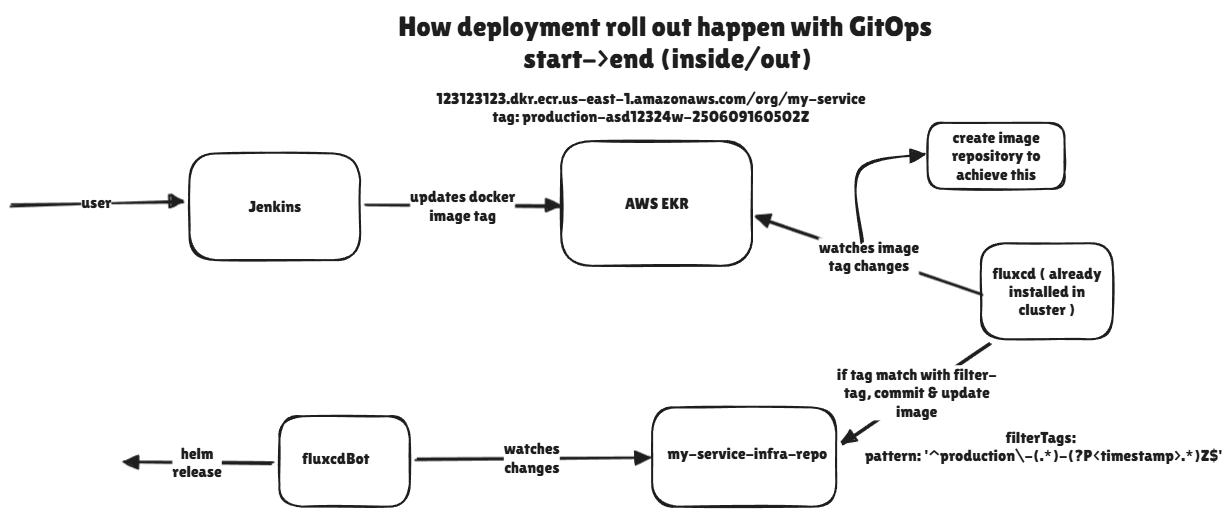
In the past, engineers manually ran deployment scripts. Today, we use GitOps. Tools like FluxCD (or ArgoCD) run inside your K8s cluster and constantly monitor your Git repository. When you merge a PR to GitHub, FluxCD instantly updates the K8s cluster to match the new code.
Self-Serve Architecture for Teams
In larger teams, infrastructure should not become a bottleneck where developers constantly depend on DevOps engineers for deployments.
A common approach is to adopt a GitOps-driven self-serve architecture.
Typical repository structure:
1
2
3
4
5
6
7
repo/
├── terraform-resources/
│ ├── s3
│ ├── networking
│ └── rds
└── k8s-resources/
    ├── helm-charts
Infrastructure resources such as clusters, networks, and databases are managed using Terraform.
Application-level deployments are managed using Kubernetes manifests or Helm charts.
Developers typically work with long-lived branches such as:
- staging
- regression
- production
When changes are merged into these branches, FluxCD continuously monitors the repository.
If Flux detects changes in Kubernetes manifests or Helm charts, it automatically synchronizes those changes to the Kubernetes cluster.
This ensures:
- Git becomes the single source of truth
- Deployments are automated
- Infrastructure changes remain auditable
9. Observability: How the ELK Stack Works
Deploying code is only half the battle. Knowing what it’s doing in production is the other half. The ELK Stack is the industry standard for centralized logging:
- E - Elasticsearch: A powerful search engine that stores your logs.
- L - Logstash (or fluentd/fluentbit): The data pipeline that collects logs from your K8s Pods, parses them, and sends them to Elasticsearch.
- K - Kibana: The UI dashboard where you can filter, search, and visualize your application logs.
When your app throws error 500s, you go to Kibana to read the exact stack trace.
10. Metrics: Prometheus, Grafana & Time Series Databases
While ELK handles logs (text), Prometheus and Grafana handle metrics (numbers over time).
- Time Series Database (TSDB): A database optimized for storing data timestamp by timestamp. Perfect for “CPU usage per second”.
- Prometheus: It scrapes metrics from your applications and stores them in its TSDB.
- Grafana: Plugs into Prometheus and visualizes the data via beautiful charts and gauges.
How to create dashboards: In Grafana, you write PromQL (Prometheus Query Language) queries (e.g., rate(http_requests_total[5m])) to pull data and put it on a graph. You can then set alerts to ping your team’s Slack if CPU usage exceeds 90%.
While ELK handles logs (text), Prometheus and Grafana handle metrics (numerical data over time).
How Metrics Collection Works
The monitoring flow typically looks like this:
1
2
3
4
5
6
7
8
9
Application
   ↓
/metrics --> Prometheus scrapes metrics
   ↓
Metrics stored in TSDB
   ↓
Grafana queries Prometheus
   ↓
Dashboards visualize data
Step 1 - Expose Metrics
Applications expose a /metrics endpoint.
Example output:
1
2
3
http_requests_total 10234
http_request_duration_seconds 0.34
cpu_usage_percent 45
Step 2 - Prometheus Scrapes Metrics
1
2
3
4
5
6
7
8
Prometheus periodically scrapes (pulls) metrics from the `/metrics` endpoint.

Prometheus configuration:

scrape_configs:
  - job_name: 'myapp'
    static_configs:
      - targets: ['myapp:8080']
Prometheus stores:
- recent data in memory
- long-term data in a TSDB (Time Series Database)
Example TSDB systems
Common time series storage systems include:
- Prometheus TSDB
- VictoriaMetrics
- Thanos
- Cortex
These systems allow long-term storage and horizontal scaling of metrics.
Step 3 - Grafana Visualizes Data
1
2
3
4
5
6
7
8
9
10
Grafana queries Prometheus using PromQL:

rate(http_requests_total[5m])

Creates dashboards with:

- Line charts
- Gauges
- Heatmaps
- Alerting rules
11. Advanced Deployments: Canary vs. Blue/Green
“Push and pray” is dangerous. Modern deployment strategies minimize downtime and risk:
Blue/Green Deployment
- You have two identical environments: Blue (currently live) and Green (idle).
- You deploy version 2.0 to the Green environment.
- Once Blue is fully tested and ready, you flip the load balancer switch so all user traffic instantly goes to Green. Blue becomes idle.
- Benefit: Immediate rollback capability by flipping the switch back.
Canary Deployment
- You route a small percentage of traffic (e.g., 5%) to the new version (the “Canary”).
- The remaining 95% stay on the stable version.
- You monitor the error rates and metrics on the Canary. If stable, you gradually increase traffic (10%, 25%, 50%, 100%).
- Benefit: Lowest risk. Bugs only impact a small subset of users before being caught.
12. CDN and Edge Infrastructure
When users access your application, every request doesn’t need to hit your origin server.
This is where a CDN (Content Delivery Network) comes into play.
A CDN is a globally distributed network of servers that caches and delivers content closer to users.
Instead of:
User → Origin Server
It becomes:
User → CDN Edge Server → Origin Server
If the content is cached at the edge, the request never reaches your origin server.
Benefits of using a CDN:
- Faster content delivery
- Reduced load on your servers
- Built-in DDoS protection
- Edge caching of static assets
- TLS termination
- Web Application Firewall (WAF)
One of the most popular CDN providers is Cloudflare.
Conclusion
DevOps isn’t a single person’s job—it’s a culture and a set of practices. By understanding these concepts—networking, containerization, orchestration, and observability—you bridge the gap between “code completing” and “code delivering value to users reliably.”
Next time you see a Dockerfile or a .yaml manifest in your repository, you’ll know exactly what’s going on!